Campaign Results Can Hide Critical Failures
You have the best marketing team, the most brilliant minds with the most genius and impactful ideas in the market. Every hire is an "A-list" player. Stakeholders are thrilled with the team's output, the ambitious campaigns and journeys built for customers. Meetings are efficient, new programs launch weekly, and the whole company feels the momentum.
Everything is going great until someone asks the one question that changes everything:
"So? How are the campaign numbers?"
The doubt lingers, and eventually reaches leadership. A business built on brilliant ideas still needs to answer a basic question: are those ideas actually working? We can't manage what isn't measured. Decisions can't be based on feelings alone, they need to be objective. They need metrics.
This became a company-wide priority: build full visibility into the customer journeys. Not just the final numbers, but everything happening between the first touchpoint and the last, a complete funnel from end to end. And this had to be done at scale, across every journey, every step, every rule that made each one different from the next.
That was the mandate: turn campaign performance from a vague sense of "it's probably working" into something measurable, explainable, and actionable, at the level of detail the business actually needed.
My own version of this story wasn't quite so dramatic, but the core problem was real. The journeys were already set up, and we were even tracking primary metrics. Results were positive, as proven by A/B tests. The problem was that at some point, in one of the journeys external to ours, a critical step was missed: an email, the main action of a campaign, wasn't being sent to customers. Nobody noticed; a few weeks went by with everything seemingly normal until the alarm finally sounded. We knew the end result, the metrics that mattered to the business, but we lacked visibility into the internal mechanisms, the individual intricacies that made up the whole. And what did that say about the campaign? Was it really working when its main component, communication, was failing?
That was a major red flag, and we needed to fix it for our campaigns before something similar happened to our journeys. Plus, if something went wrong at another stage or if we wanted to optimize the process, we'd need a more granular look at the inner workings to know exactly where the issue was and whether our actions were actually yielding results.
We needed to build funnels: an automated, SQL-based data pipeline built in Databricks that tracks exactly where every single customer is within a marketing campaign at any given time. Instead of just looking at the final sales numbers, we needed a system that reconstructs each customer's journey step-by-step, so the business could pinpoint exactly where drop-offs or technical failures, like unsent emails, occur.
End-to-End Funnels Make Every Journey Step Visible
All funnels follow the same steps, even though the specific rules behind each step can vary from journey to journey. This is where much of the complexity lives: it isn't just one funnel to track, but many journeys running in parallel, each with its own eligibility criteria and business rules layered on top of a shared structure. Across all of them, the objective was the same, count the number of distinct customers at each step to see how conversion was performing. On top of that, we also wanted a historical view of these funnels, meaning we could see performance for a specific run, a date when customers entered that we wanted to investigate.
Simplicity Keeps the Pipeline Maintainable
The methodology behind this project was built around a single requirement: simplicity. The funnel needed to be simple enough to build quickly, simple enough for stakeholders to look at and understand right away, and easy enough for other people to manage and extend the project going forward, including the underlying business rules, not just the code.
In practice, this meant prioritizing the simplest working solution at every step: building the clearest version of the funnel first and presenting it to stakeholders quickly to gather feedback, only introducing complexity when it was actually needed. This kept the pipeline understandable and maintainable, rather than accumulating unnecessary complexity in pursuit of a "perfect" solution upfront.
This focus on simplicity is what makes the resulting pipeline easy to manage today: it's documented not only in terms of code, but also business rules, so anyone on the team can understand how a given journey works end to end. Optimizations are only introduced when they're actually needed, keeping the system lean and focused on what matters, accurate, actionable visibility into every customer's journey.
Historical Funnels Require Point-in-Time Customer Data
We had four journeys (five from a business perspective, since one of them split into two), and in general, the funnels were very similar. The steps we intended to track were:
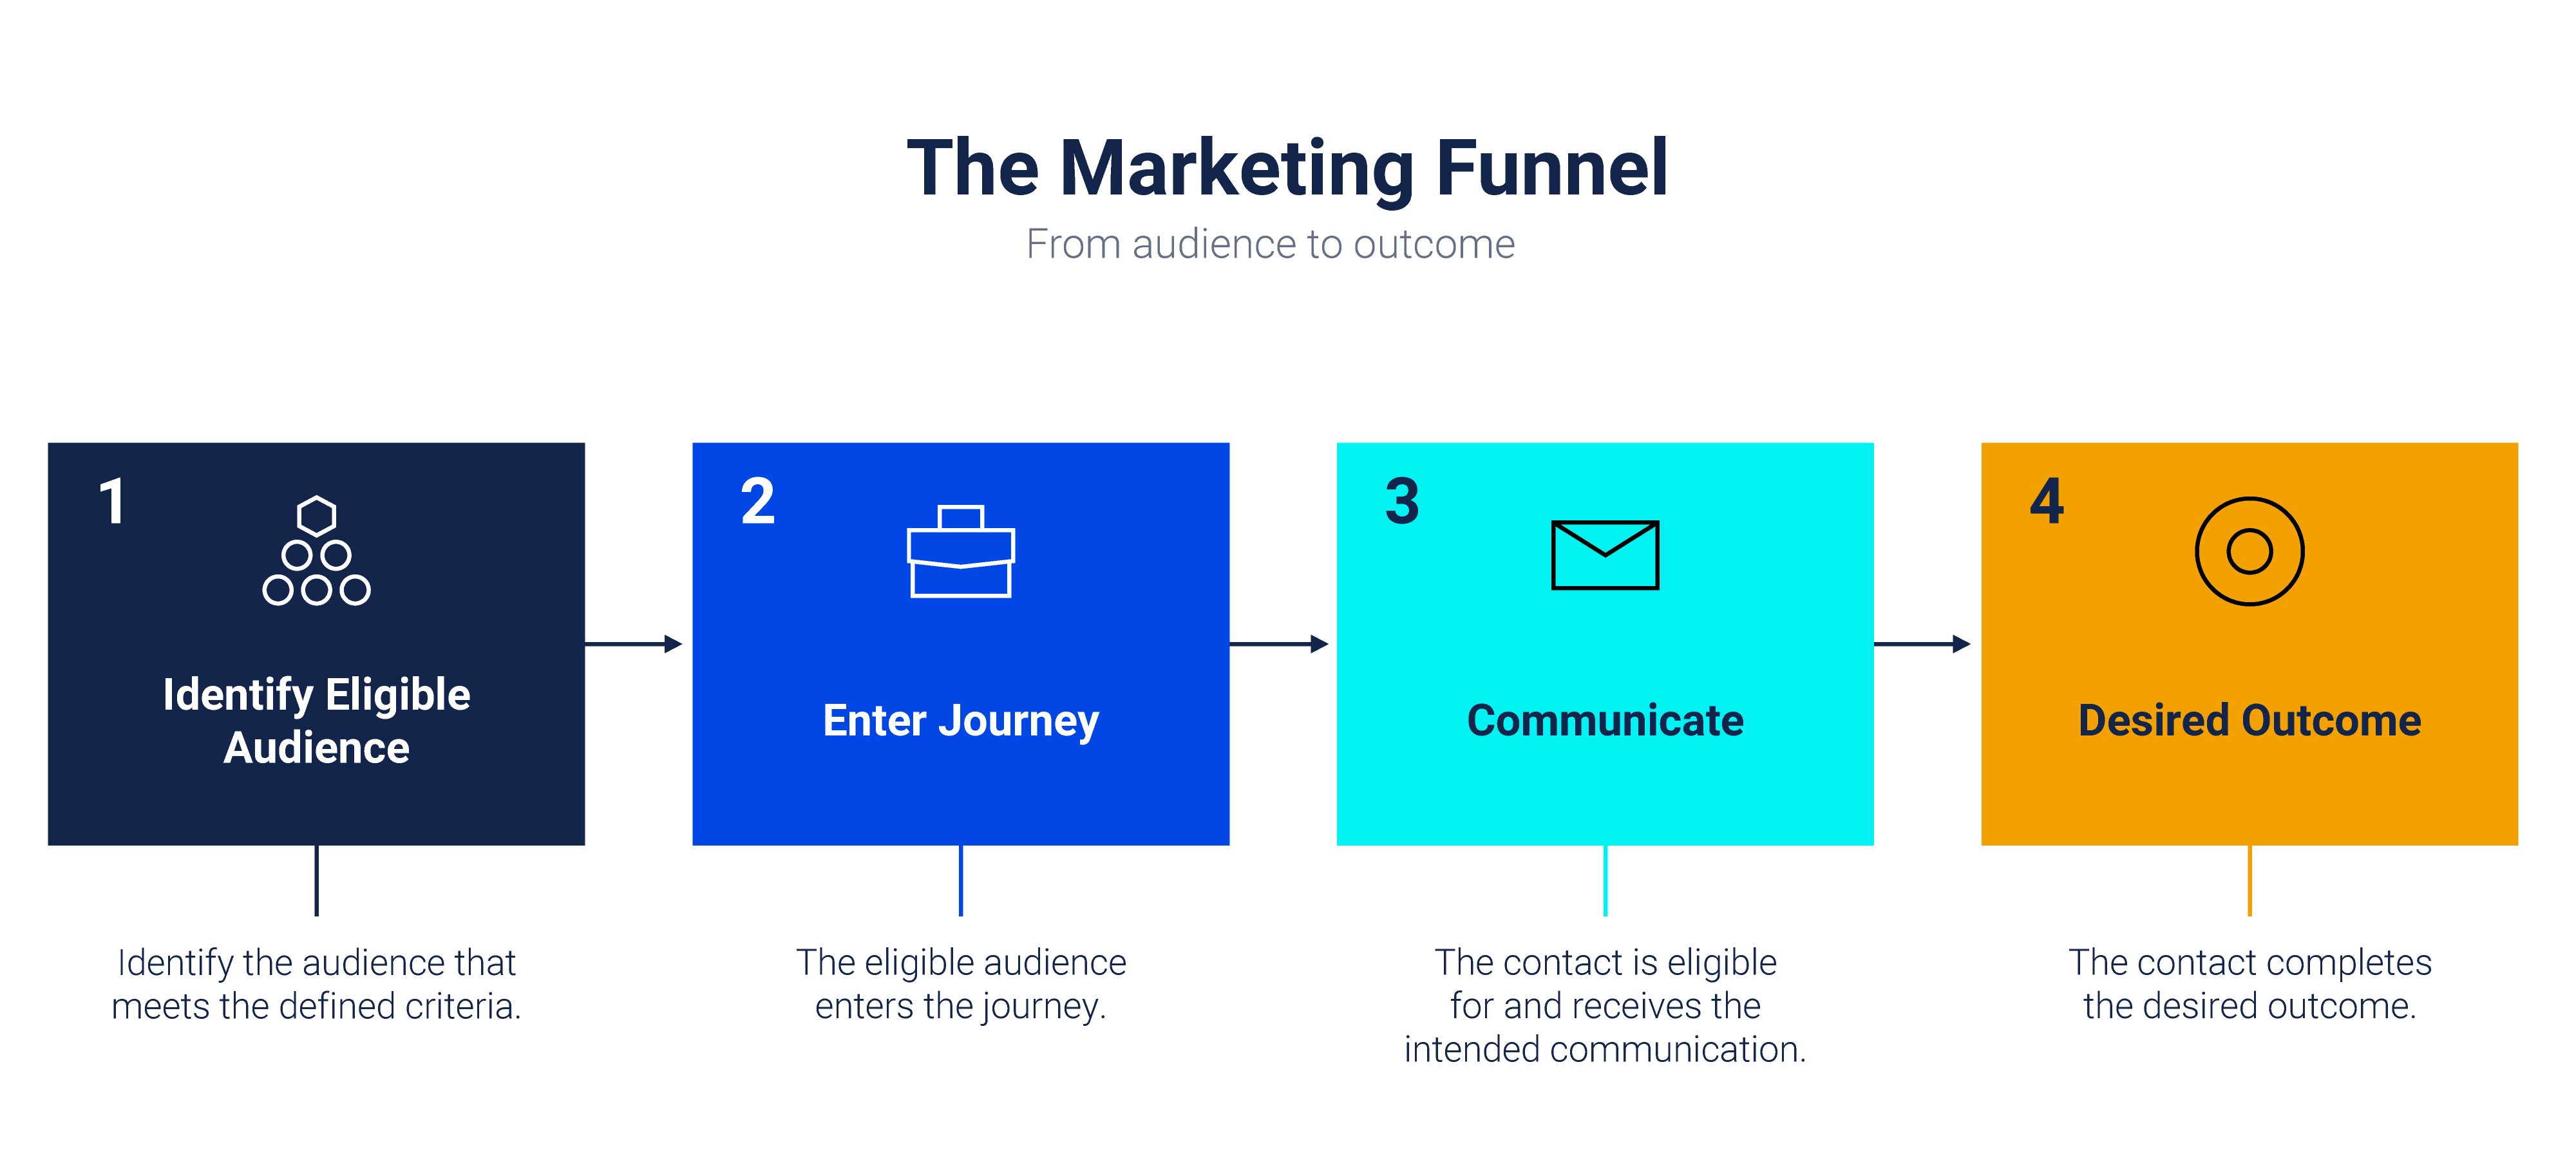
We needed to historically reconstruct the conditions of the funnels at the moment they ran (we'll use "synced" and "run" interchangeably). For eligibility, for example, we had to know the customers' properties and conditions in the past as well. Communication could be sent via email, push, or SMS, with each journey having its specific combination of the three. Conversion was related to the journey's success rules, while redemption dealt with using the reward, a coupon, though sometimes both were the same thing.
Our data lived across different sources:
- CRM tables
- Databases from internal systems
- Tables from a marketing tool
We had raw layer tables available (ingestion handled by an external team) that covered almost all our data needs, with one exception: the CRM tables required additional work. Uniquely identifying the rows the way we needed wasn't straightforward, so we built an external transformation pipeline to get the email, push, and SMS information at the granularity and format required: one communication per customer, with its date, message, and a few classification properties. This was built outside the funnel project, since these are tables used by other projects as well and weren't in a database commonly used by our team. This process was built with a DAB (Declarative Automation Bundle), with its own jobs and CI/CD, covered in more detail later.
With this in place, we had all the base tables needed to build the funnel. This is also where Databricks proved its usefulness through Unity Catalog, giving us centralized and governed access to all the data even though it lived across different catalogs. Where several processes would previously have been needed to unify these sources into a single system, we could now just reference the tables directly in our code.
Having access to all the necessary data, unified and ready to use, removed an entire layer of integration work that would otherwise have been required to bring these sources together.
SQL Standardizes Funnel Logic Across Journeys
As a reminder, the steps were:
- Eligibility
- Journey Entry
- Communication
- Outcome
Each journey has its own set of transformations and tests, but they shared many common characteristics, so in terms of structure, they were practically identical.
All code was written in SQL for a few reasons:
- It guaranteed Databricks' internal optimizations; the focus stayed entirely on writing good SQL.
- Simpler and easier to build.
- There are more people who know SQL than Spark.
The trade-offs compared to Spark were:
- Code modularity.
- Code reusability.
- Complex logic.
Since these trade-offs weren't a problem and project universality was a priority, meaning anyone should easily be able to manage them, choosing SQL files wasn't hard.
Overall, each step had its own table being generated, a Delta table (Materialized Views are blocked by policies). Some of them had more than one table, like eligibility, split between the initial table with customer properties at a given time and one with filter rules to be eligible. Communication too, which could have a table for each channel: email, push, or SMS.
Initially, the code was just a CREATE OR REPLACE TABLE for everything, but that soon needed optimization, since it involved millions of customers, each evaluated on different dates, meaning massive tables. Because of this, upsert logic with MERGE INTO was applied to only process new customers or those who updated for some reason. Some tables kept the simpler logic, covered individually below.
Two orchestration approaches were considered for the funnel: Lakeflow declarative pipelines, which would abstract some logic, mainly around appends, and an orchestrated Lakeflow job. Declarative pipelines weren't a fit here because not all funnel steps could be replicated by it, given complex business rules that weren't simple appends, plus materialized views (ideal for some steps) weren't available. An orchestrated Lakeflow job was used instead, kept in the same format across all steps for consistency. As covered in Orchestration & Deployment, DAB made organizing the whole project significantly easier.
This gave a complete view of each step of the funnel, usable for investigation or to build other processes in the future. Many of the funnel's business rules were concentrated into two final tables. One holds each customer at each journey sync date with binary flags indicating which steps they reached. The other aggregates this data by date with the number of customers at each step.
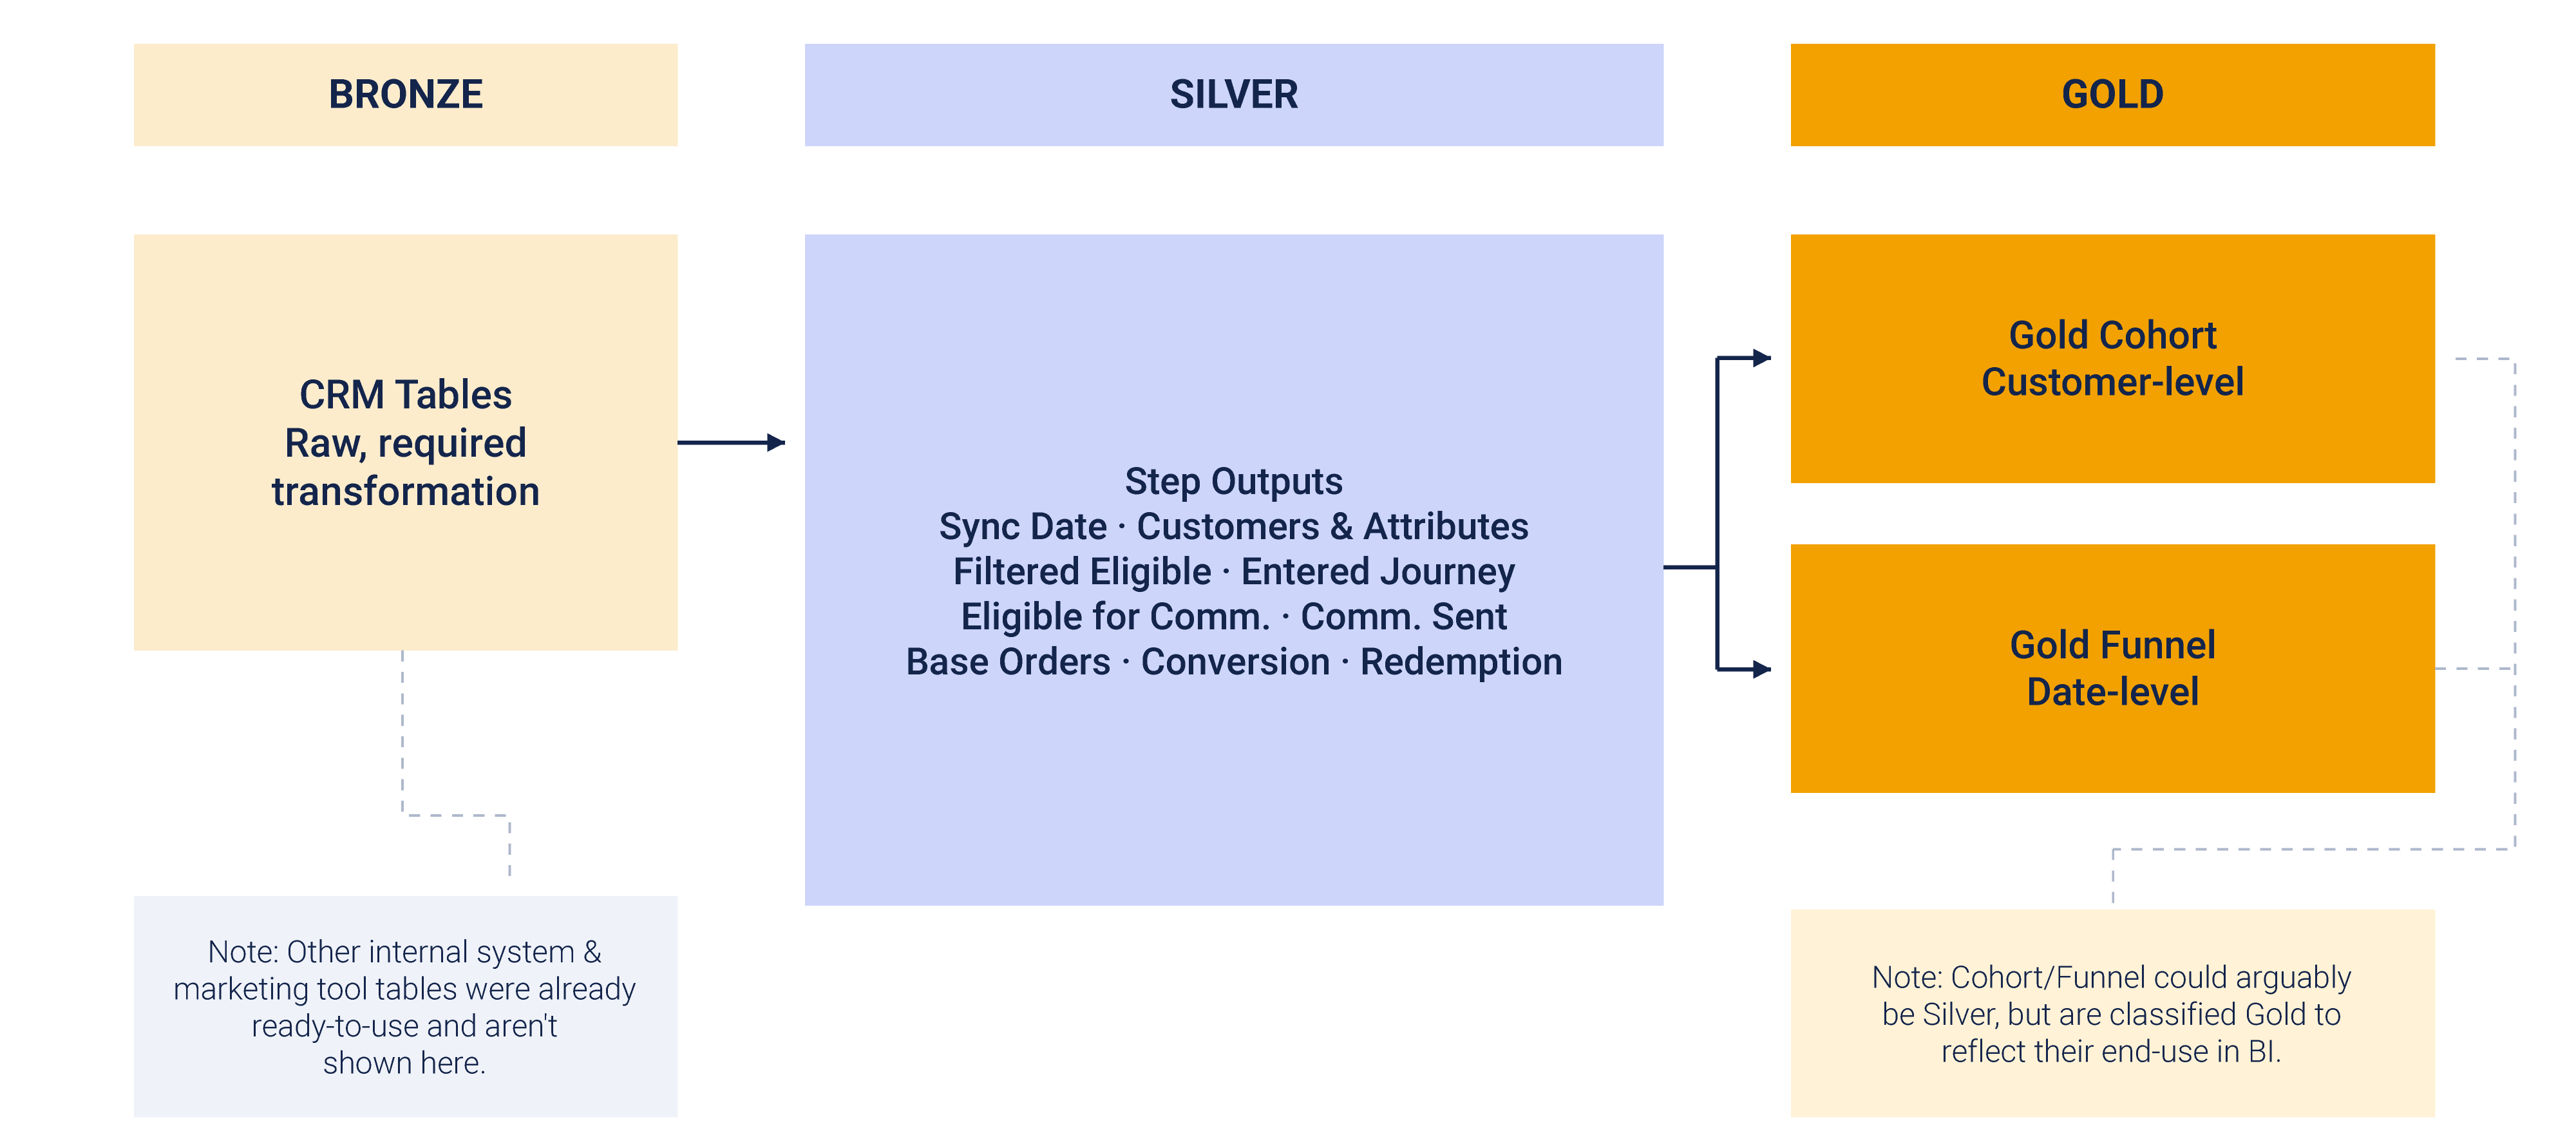
This also follows a medallion architecture. Bronze were the CRM tables that required transformation (other tables from internal systems and marketing tool were already ready to use and aren't listed here), Silver were the outputs of each step's files, and Gold were the two final tables (the customer-level and date-level tables could be considered Silver, but were classified as Gold to reflect their end-use in BI).
On top of these final tables, simple visualizations were built directly inside Databricks for validation with stakeholders, soon to be migrated to Power BI, made easier by the existing infrastructure already used by other processes for BI connectivity.
All tables were created with write optimization to avoid the "too many files" issue, along with automatic optimization enabled. On top of that, all were clustered on Customer ID and journey run/sync dates, facilitating subsequent funnel steps as well as later analytical work.
In general, these are all the files and tables that make up each journey's pipeline, from the intermediate tables through to the final gold tables:
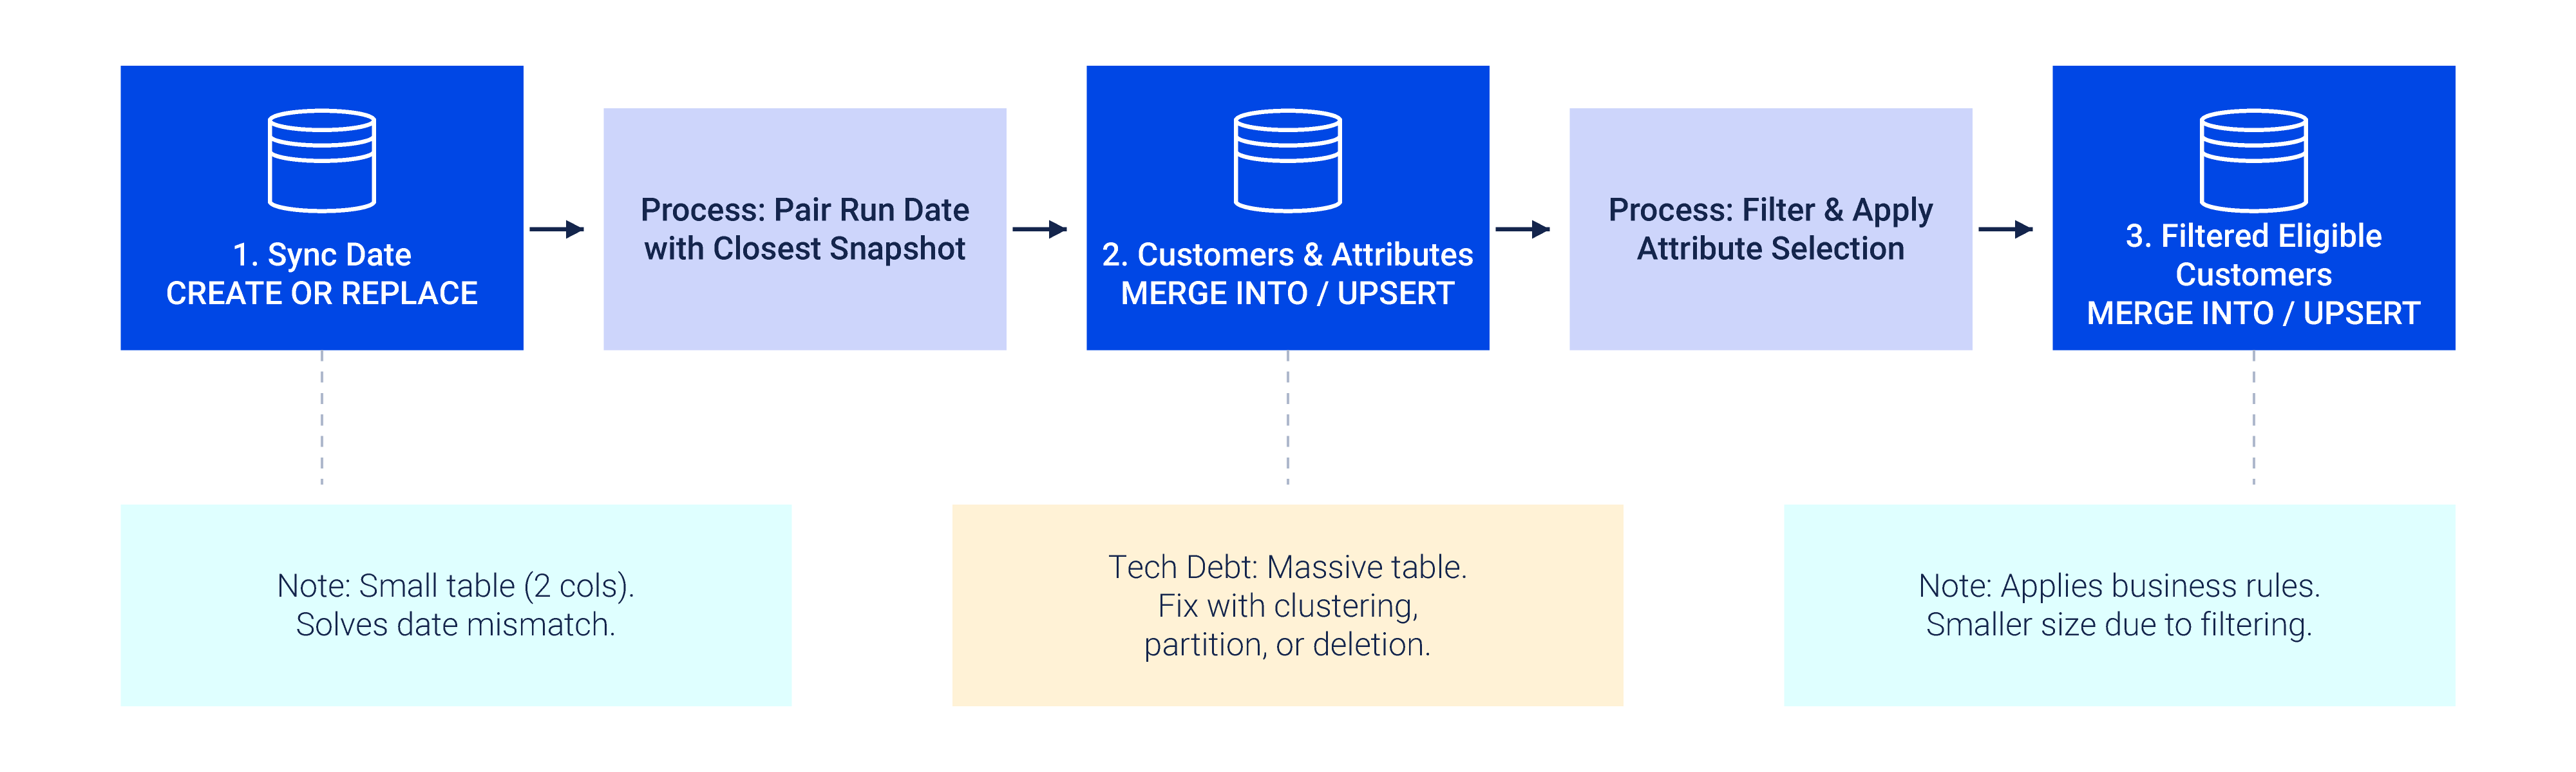
Eligibility Reconstructs Customer State at Every Run
These tables establish which customers could enter the journey and pair them with the correct snapshot of their attributes on the relevant sync date.
- Sync Date - The dates when journeys ran didn't always coincide with snapshot dates for customer properties (remembering that customer eligibility is temporal, meaning we took their characteristics on a specific date to verify eligibility), so a table was created pairing the run's sync date with the closest snapshot date of customer attributes. It's not a large table, only having two columns, so CREATE OR REPLACE was the simplest solution.
- Customers and all their attributes - A table with each customer who could be eligible and their essential properties for the journey at each sync and snapshot. A huge table—we're talking about millions of customers multiplied by the number of runs. This table made it easier to understand how the journey actually worked and its eligibility criteria. Initially, it was a single table with attribute selection logic and filters already applied, but splitting it made it easier to understand and investigate issues. A next step is to address this table becoming too large, which brings two problems: the first is performance, though that's easy to solve with clustering or date partitioning; the second is storage cost, which is harder to work around. One solution is going back to a single table with filters already applied. The other is deleting old values.
- Filtered Eligible Customers - It uses the previous table and applies business rules to select only eligible customers for the journey on that specific date.
Engagement Tables Track Entry Through Communication
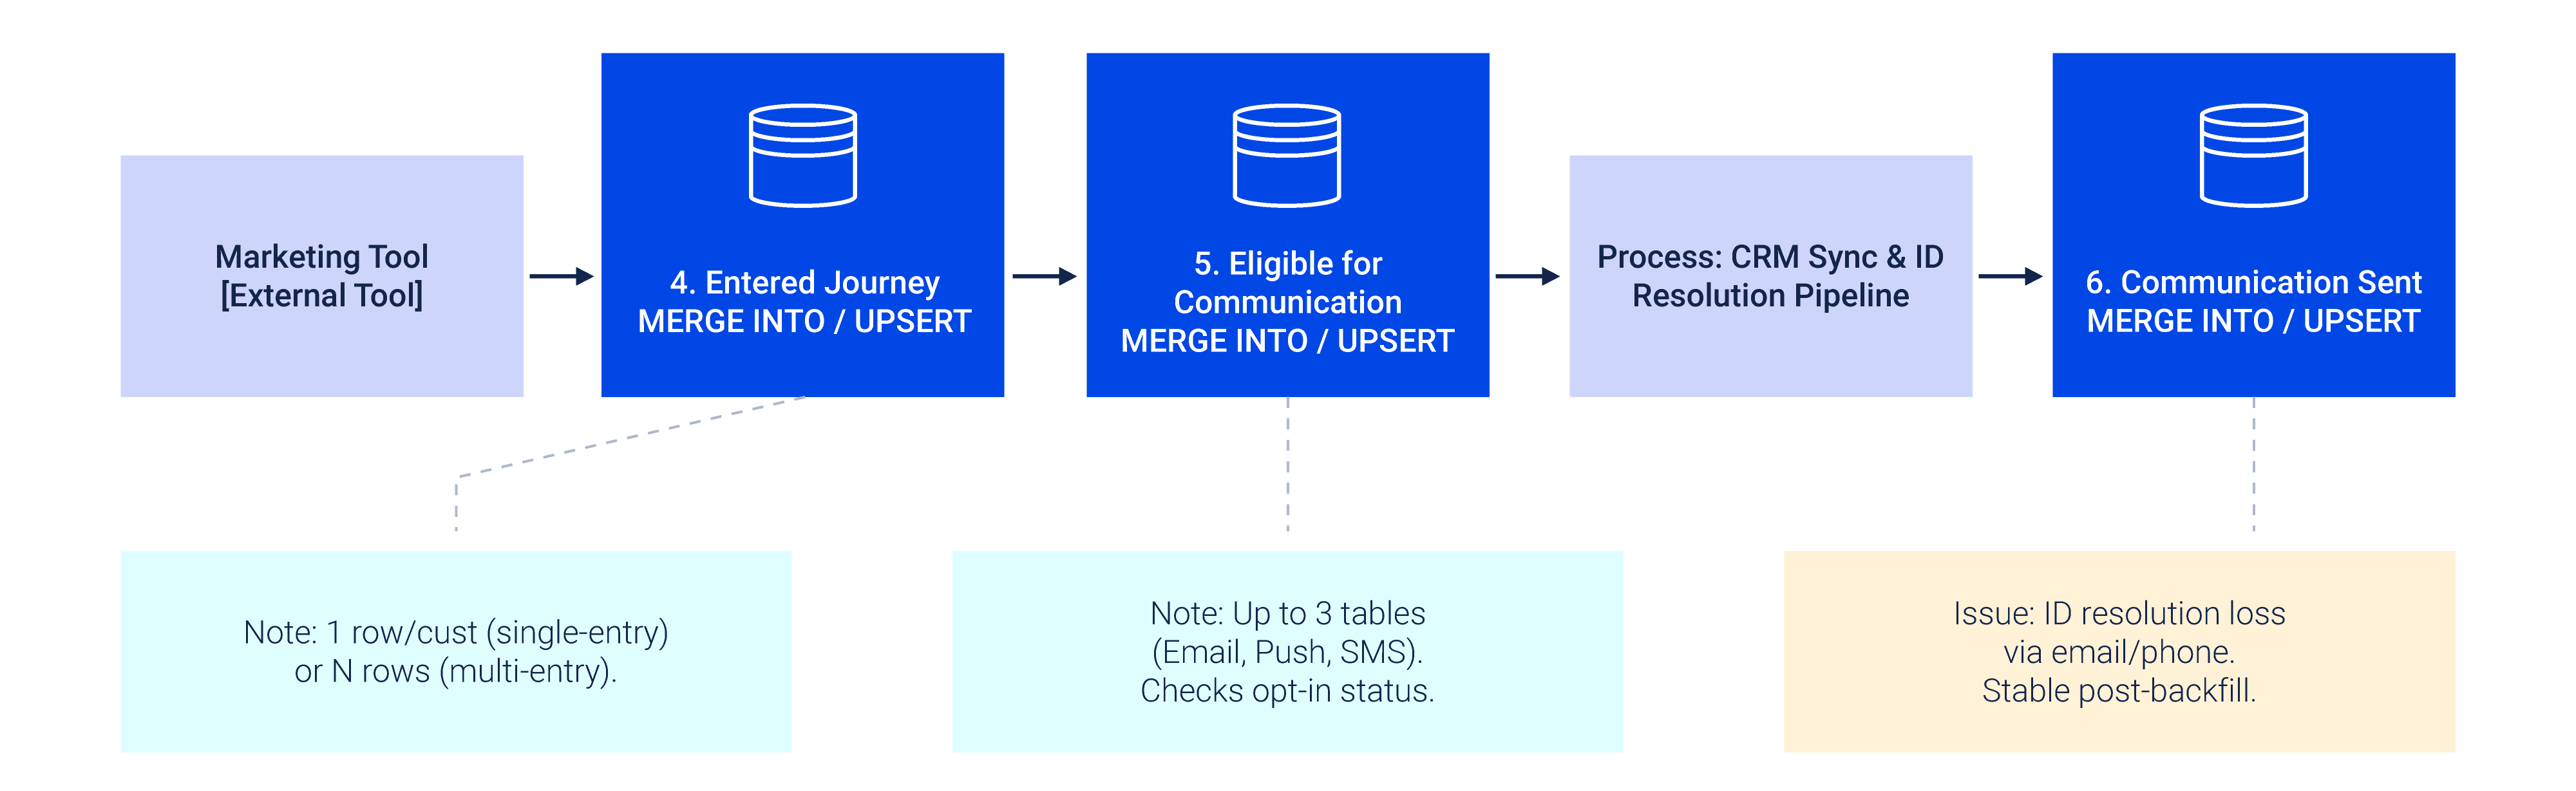
These tables track customers as they move through the journey itself, from entry to whether they were actually reached with a communication.
- Entered Journey - We have the dates when customers entered the journey. It comes from a table in the marketing tool orchestrating the processes, marketing tool. For single-entry journeys, it's one row per customer, and for multi-entry journeys, N rows per customer. Not a technical concern.
- Eligible for Communication - Up to three tables of this type can exist per journey, email, push, and SMS, but all are essentially the same. At this step, we check if the marketing tool syncs users with CRM for communication. Not all users opted into communication. Not a technical concern.
- Communication Sent - Up to three tables of this type can exist per journey, email, push, and SMS, but all are essentially the same. Tables containing each sent communication across all three types for customers. This has a major problem regarding ID resolution to identify customers using email or phone. A few processing steps implemented in the external CRM pipeline are necessary, but even so, we lose some customers to resolution here. The base tables require processing, but after the first run with creation and retroactive backfill, it's not a big issue for future upserts.
Conversion Tables Connect Journeys to Outcomes
These tables connect customers to their orders and apply journey-specific rules to determine conversion and redemption.
- Base orders - Contains relevant orders for that journey. It's the base table to check conversion or redemption.
- Conversion - Applies specific rules for each journey. We already have a large filter by customer here.
- Redemption - Applies specific rules for each journey. We already have a large filter by customer here.
Gold Tables Turn Journey Data Into Analysis
These are the summary tables built for reporting and analysis on top of the full funnel.
- Gold Cohort - Summarizes the funnel state of each customer in each sync run. The best table to build analytics on top of.
- Gold Funnel - Customer count at each funnel step by date.
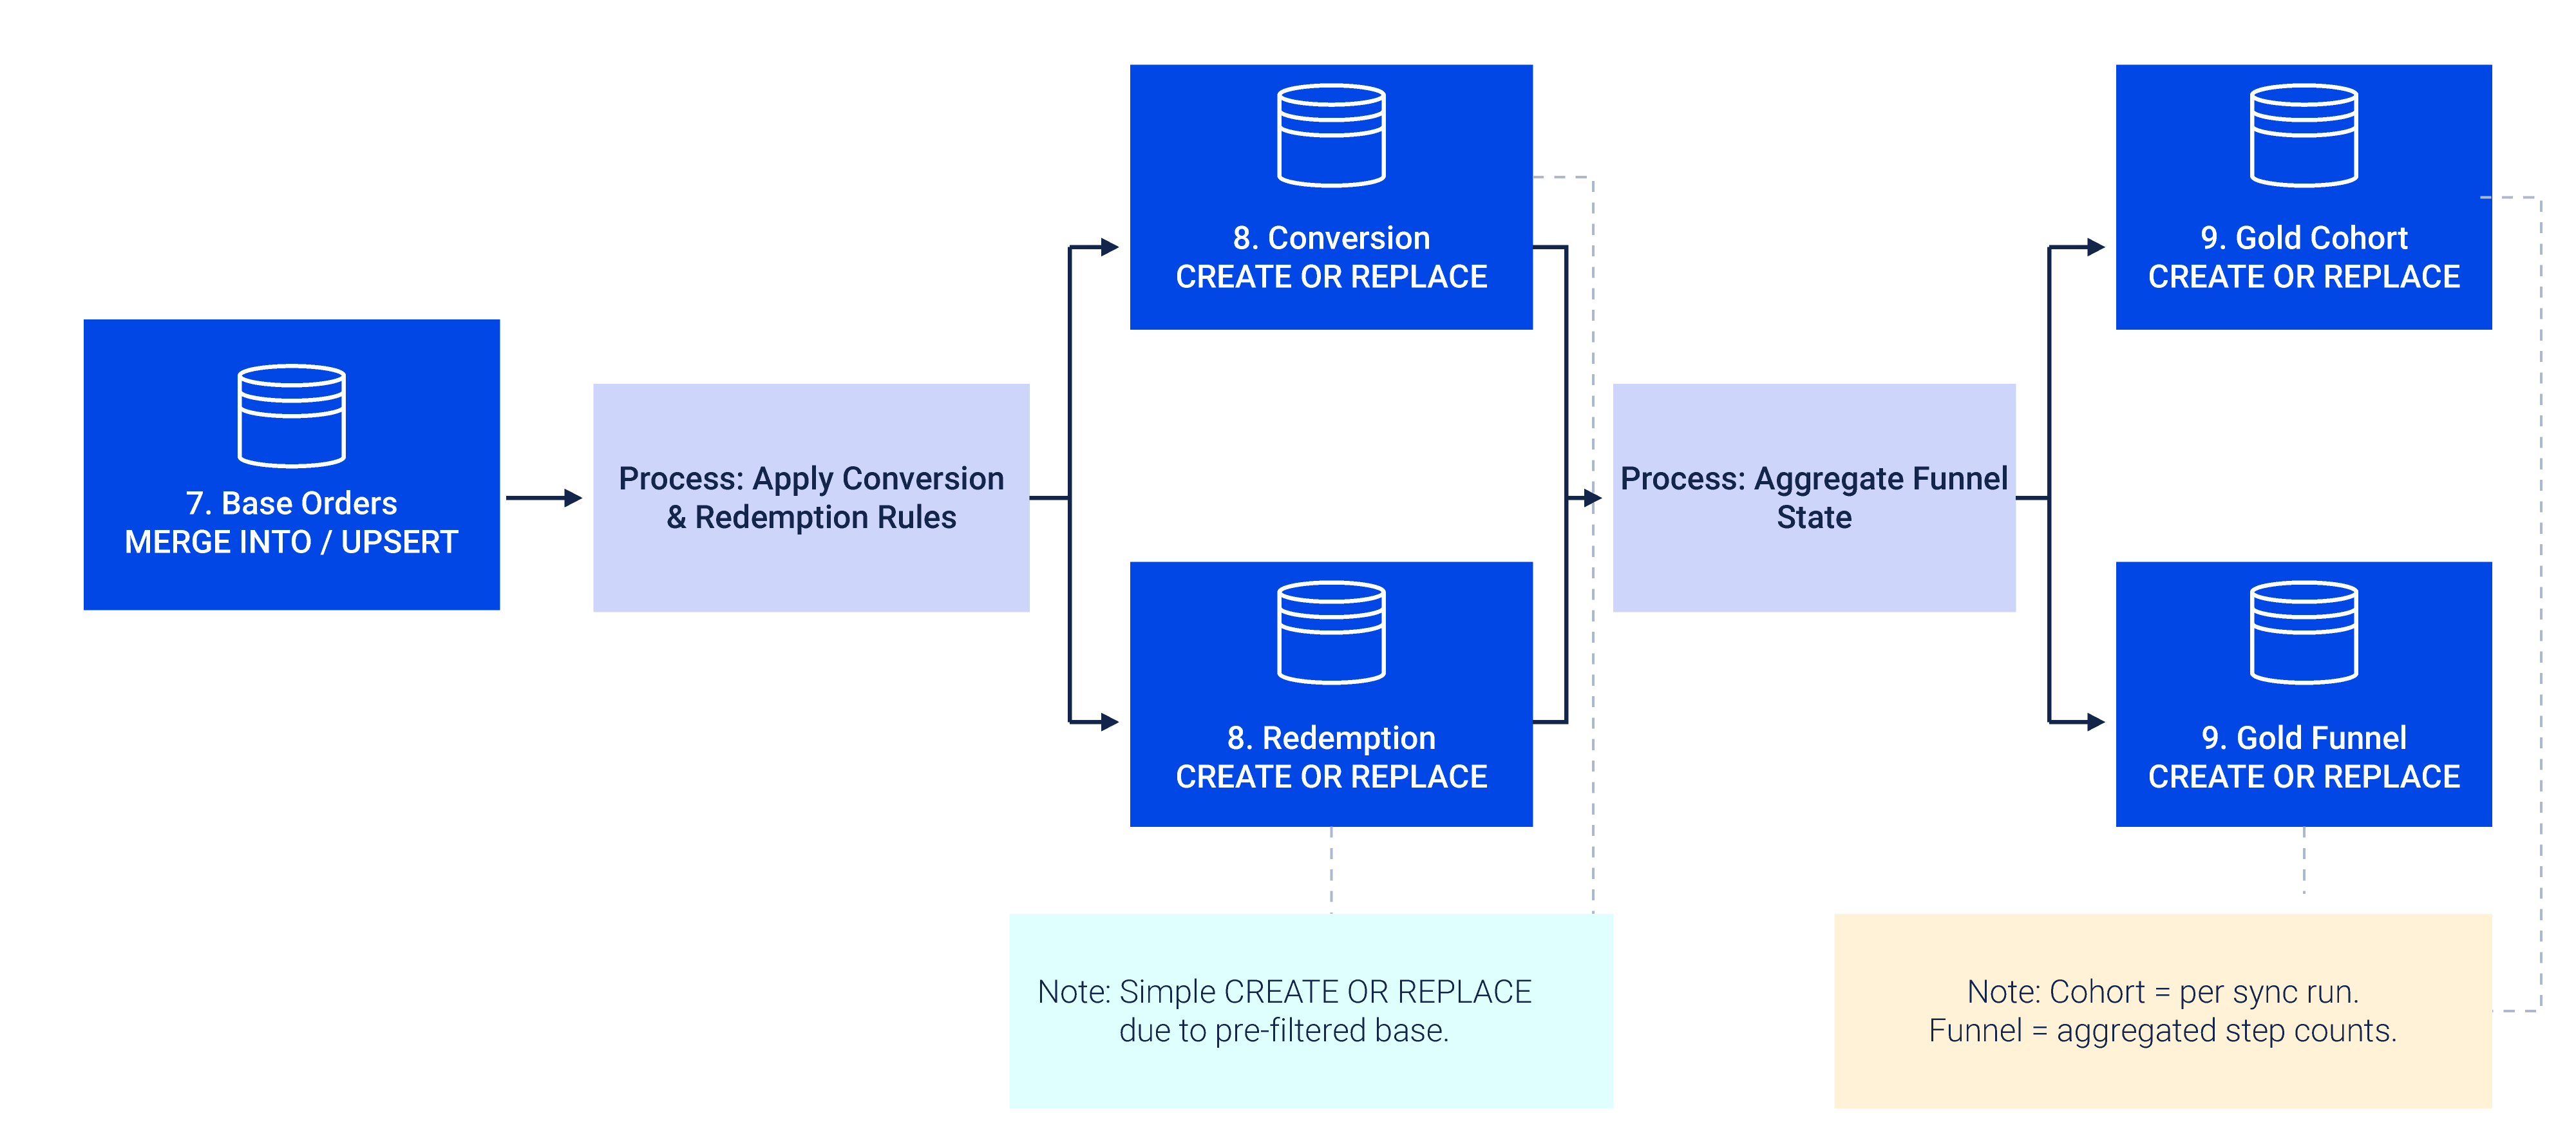
Table Workloads Determine the Write Pattern
Across all these tables, we use two insertion patterns depending on the table's size and purpose:
- CREATE OR REPLACE - Used for tables that are small, heavily filtered by customer already, or fully recalculated on each run. This applies to Sync Date, Conversion, Redemption, Gold Cohort, and Gold Funnel.
- Manual UPSERT via MERGE INTO - Used for tables that accumulate history over time and need to preserve previous runs' data, keyed on Customer plus the relevant date field for that table (journey run date, entry date, communication sync date, communication send date, or order date). This applies to Customers and all their attributes, Filtered Eligible Customers, Entered Journey, Eligible for Communication, Communication Sent, and Base orders.
Four Test Layers Catch Journey Failures
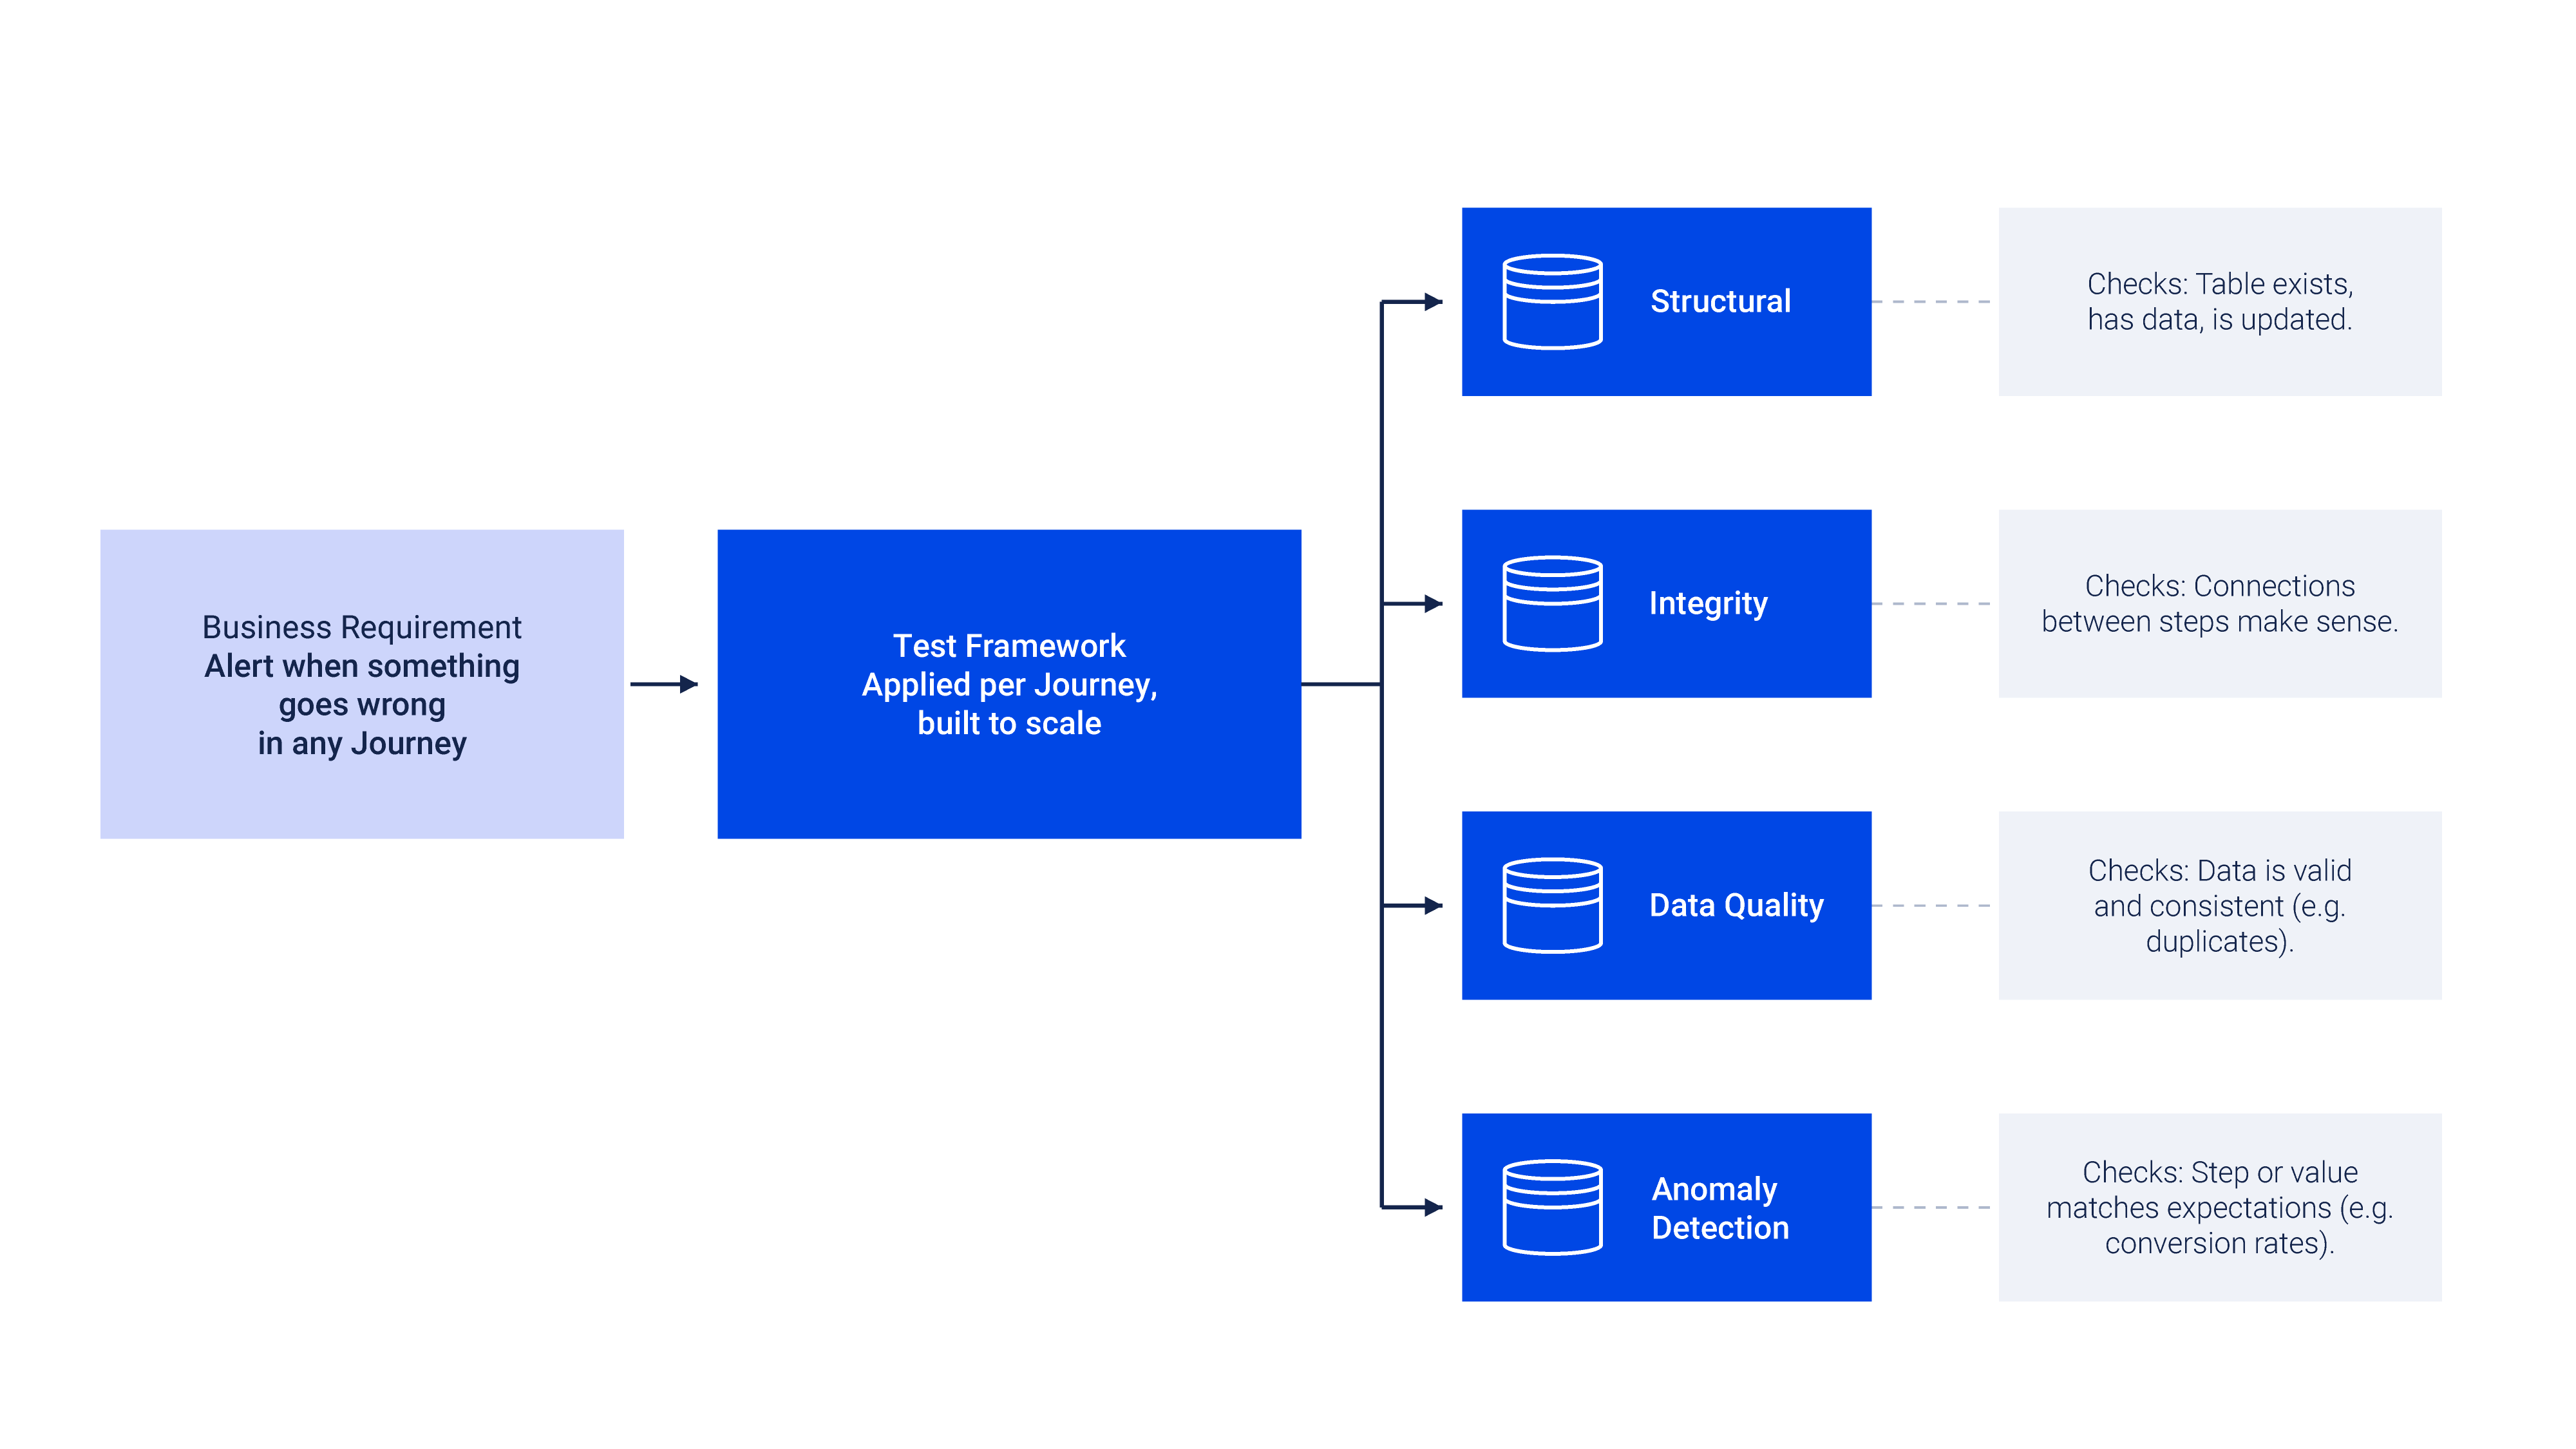
The first business requirement was that we should have alerts when something goes wrong in any journey. And what exactly is "going wrong"? The lack of communication delivery was already a concern from the start, it triggered the whole project, but there were other places where the need for alerts could be evaluated.
To address this, we built a test framework designed to scale with the project's needs. Each journey has four types of tests:
- Structural - Checks if the table exists, has data, or is updated.
- Integrity - Checks if the connections between steps make sense.
- Data quality – Checks if the data is valid and consistent, such as whether duplicates exist.
- Anomaly Detection - Verifies if any step or value is not according to expectations, like conversion rates for a specific step.
Each type of test has several individual tests, which are specific to each journey, yet very similar to one another. Each test is a SQL file with a raise error in case a condition isn't met.
The tests job is divided into four tasks for each type: structural, integrity, data quality, and anomaly, and within each, the tasks that run each individual file. This gives modular jobs with varying granularities, making it possible to evaluate the overall process at multiple levels, from the highest one, checking if the pipeline as a whole ran, down to individual tasks, all hierarchically related.
Since Lakeflow allows dependencies between tasks, funnel transformations were implemented sequentially, meaning if one fails, the subsequent ones won't run. This is important as an alert that something went wrong; after all, the funnel must work as a whole, and in this case, the goal is to stop everything and fix the problem. Tests, on the other hand, mostly run in parallel, both the jobs by test type and individual tests. Those that happen in sequence use the "run_if: ALL_DONE" clause so the flow isn't stopped. Lakeflow allows full customization for each case.
There are many files, but the framework was built to scale, it never became an unscalable mess in the project. DAB helped significantly here, covered in detail in Orchestration & Deployment. The main downside is that new tests have to be incorporated into the relevant yaml file manually, the system doesn't automatically detect tests like pytest, but the simplicity and flexibility of this framework far outweigh that cost.
Each test was built as SQL to ensure everything that needed testing was covered. This already provides technical and business validation, with a future path to migrate to Databricks' native table monitoring tool, as well as its native alerting feature. For now, they run as tasks in a job, covered next.
Lakeflow Jobs and DAB Standardize Deployment
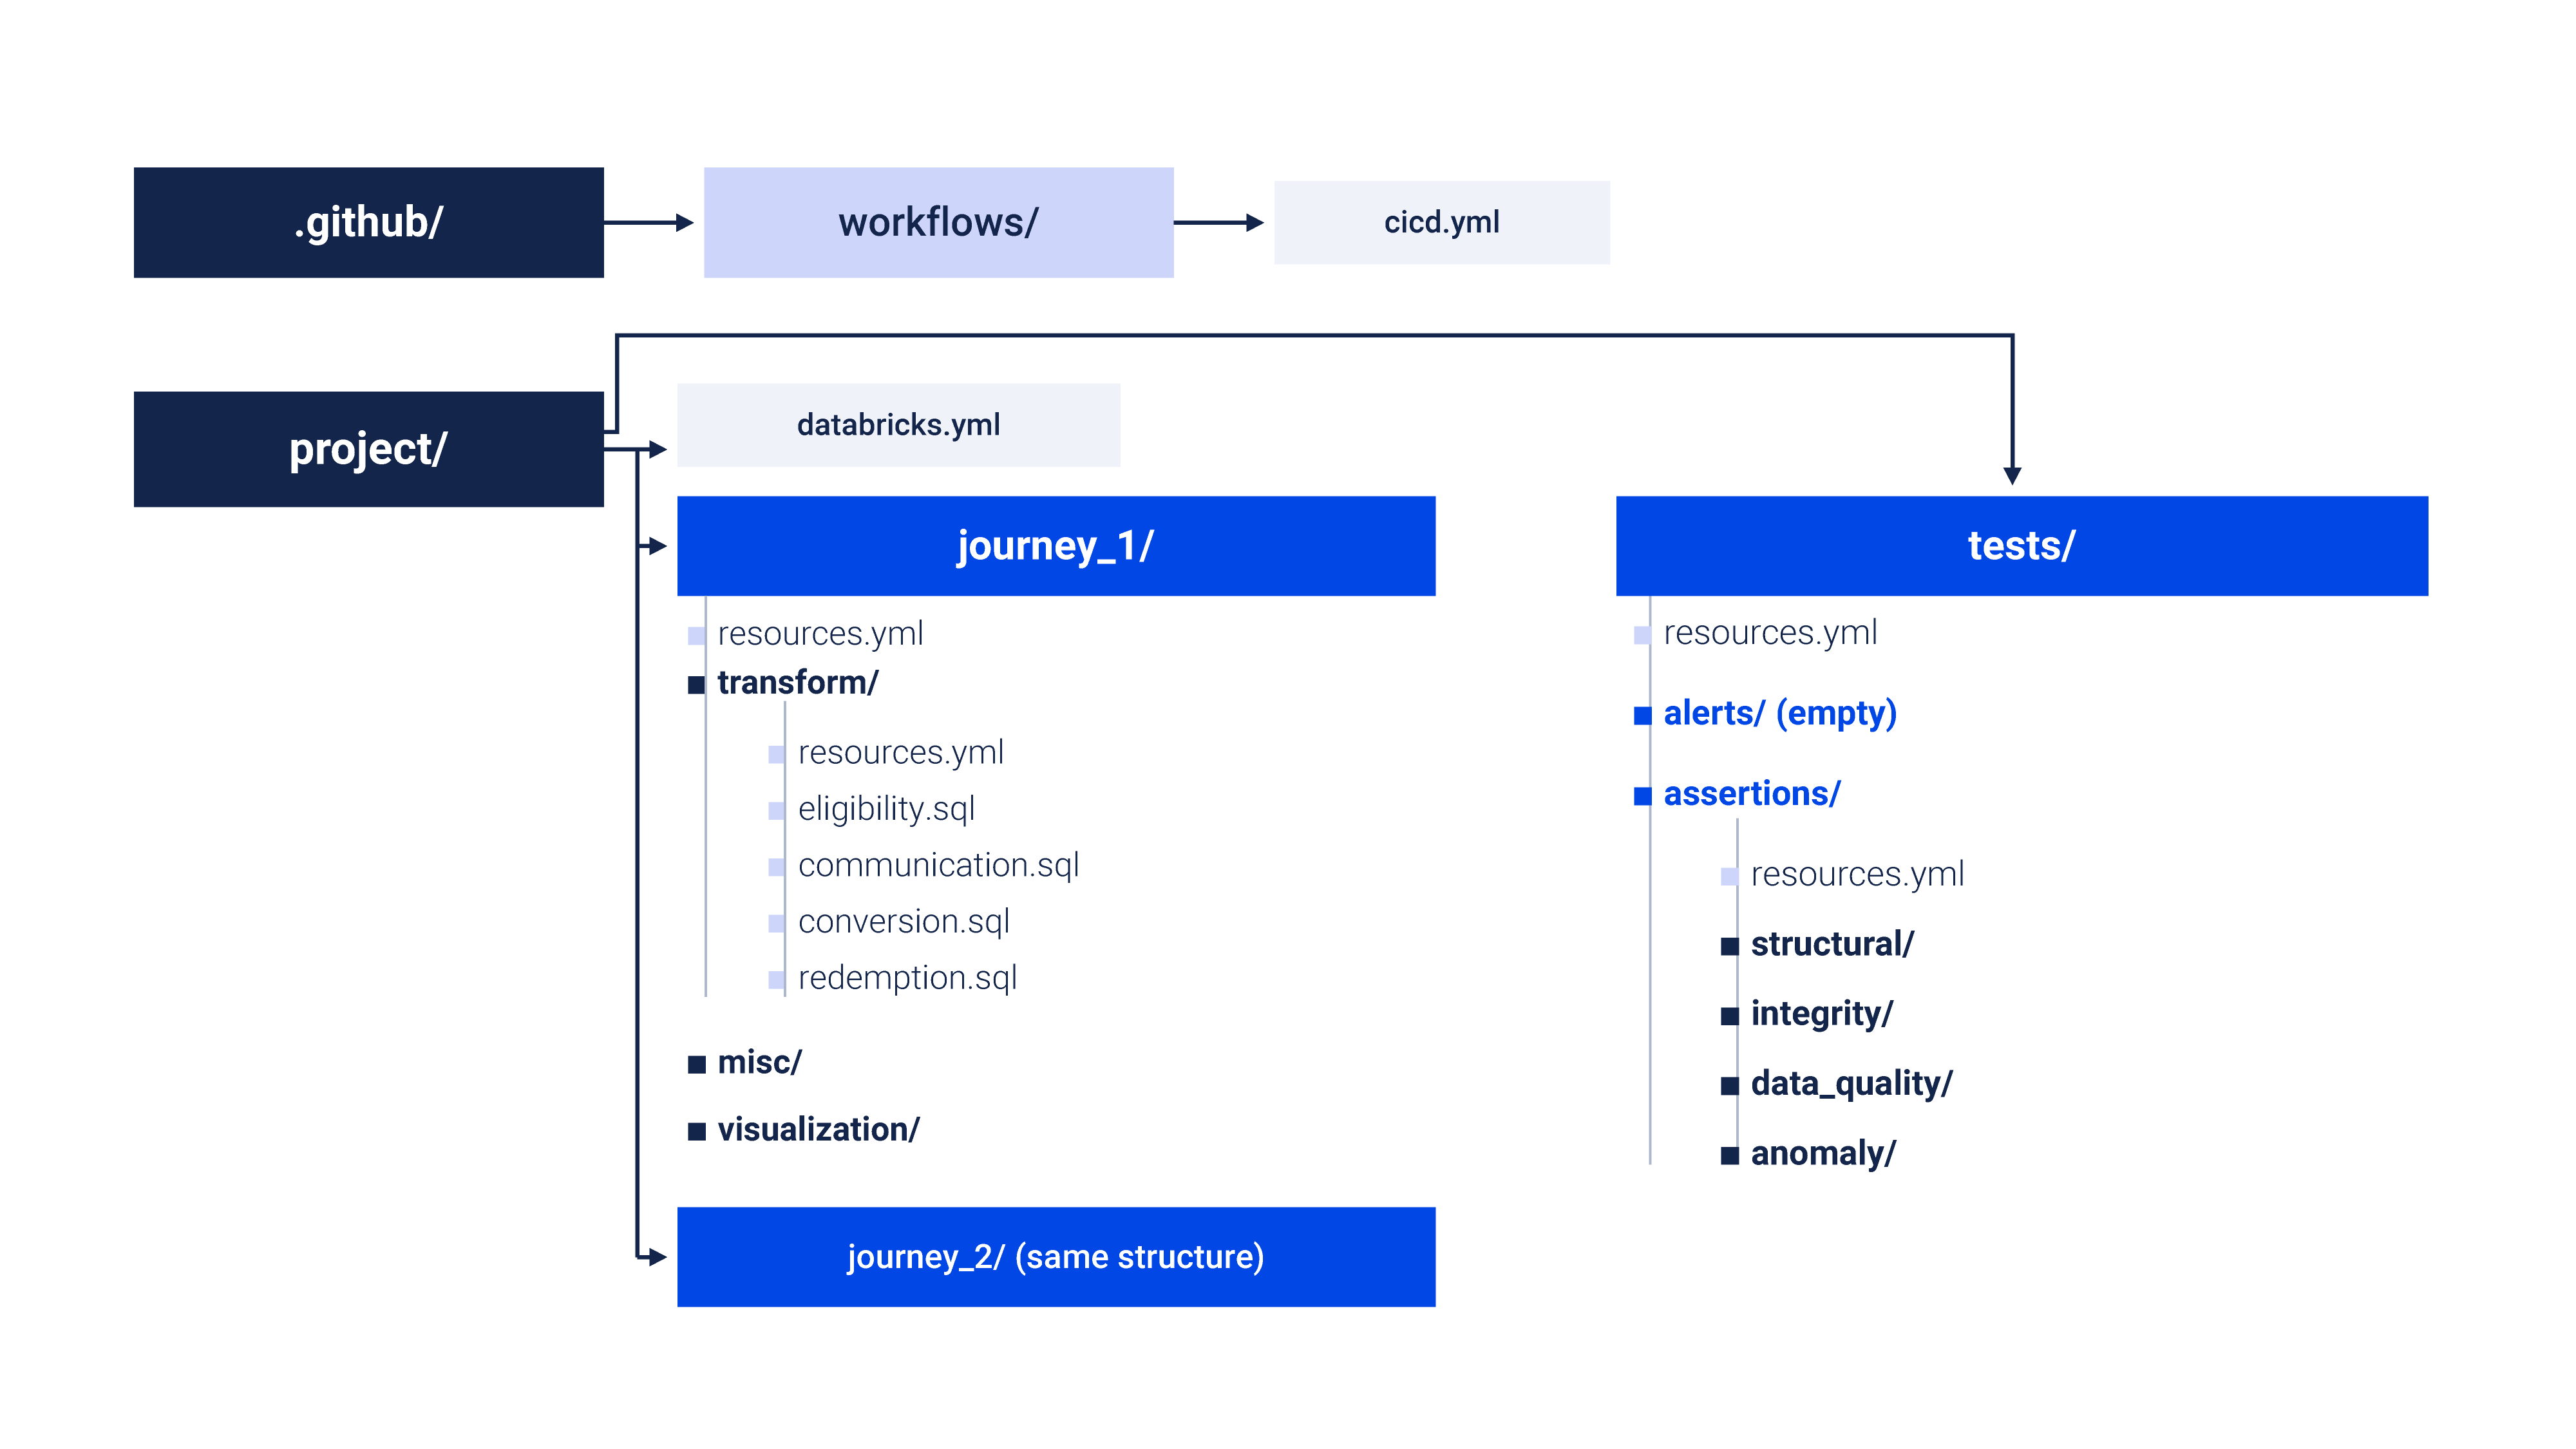
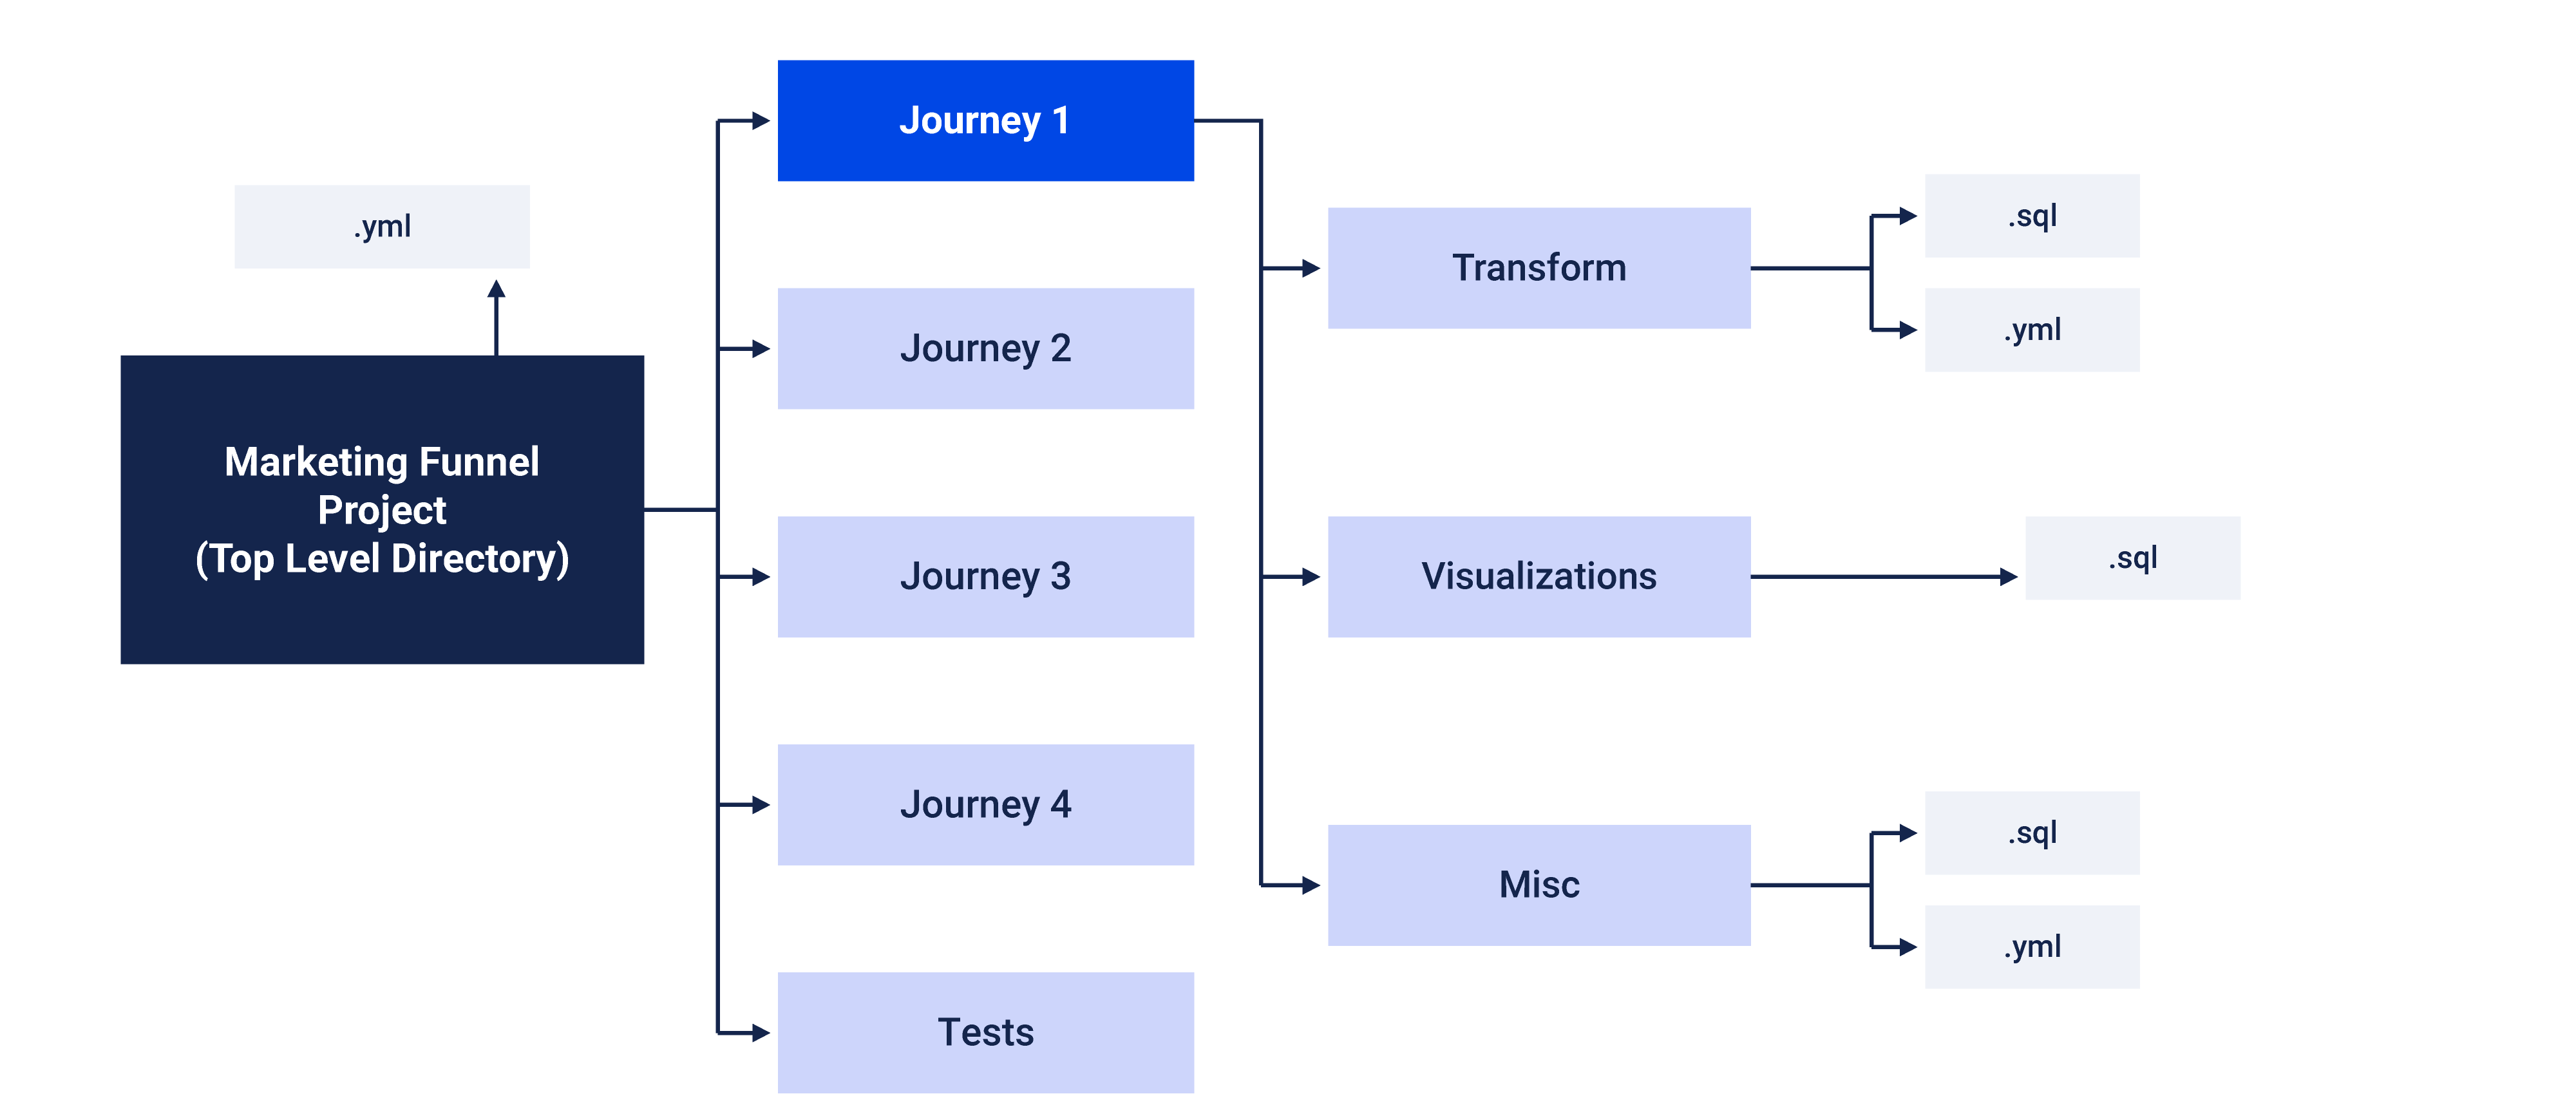
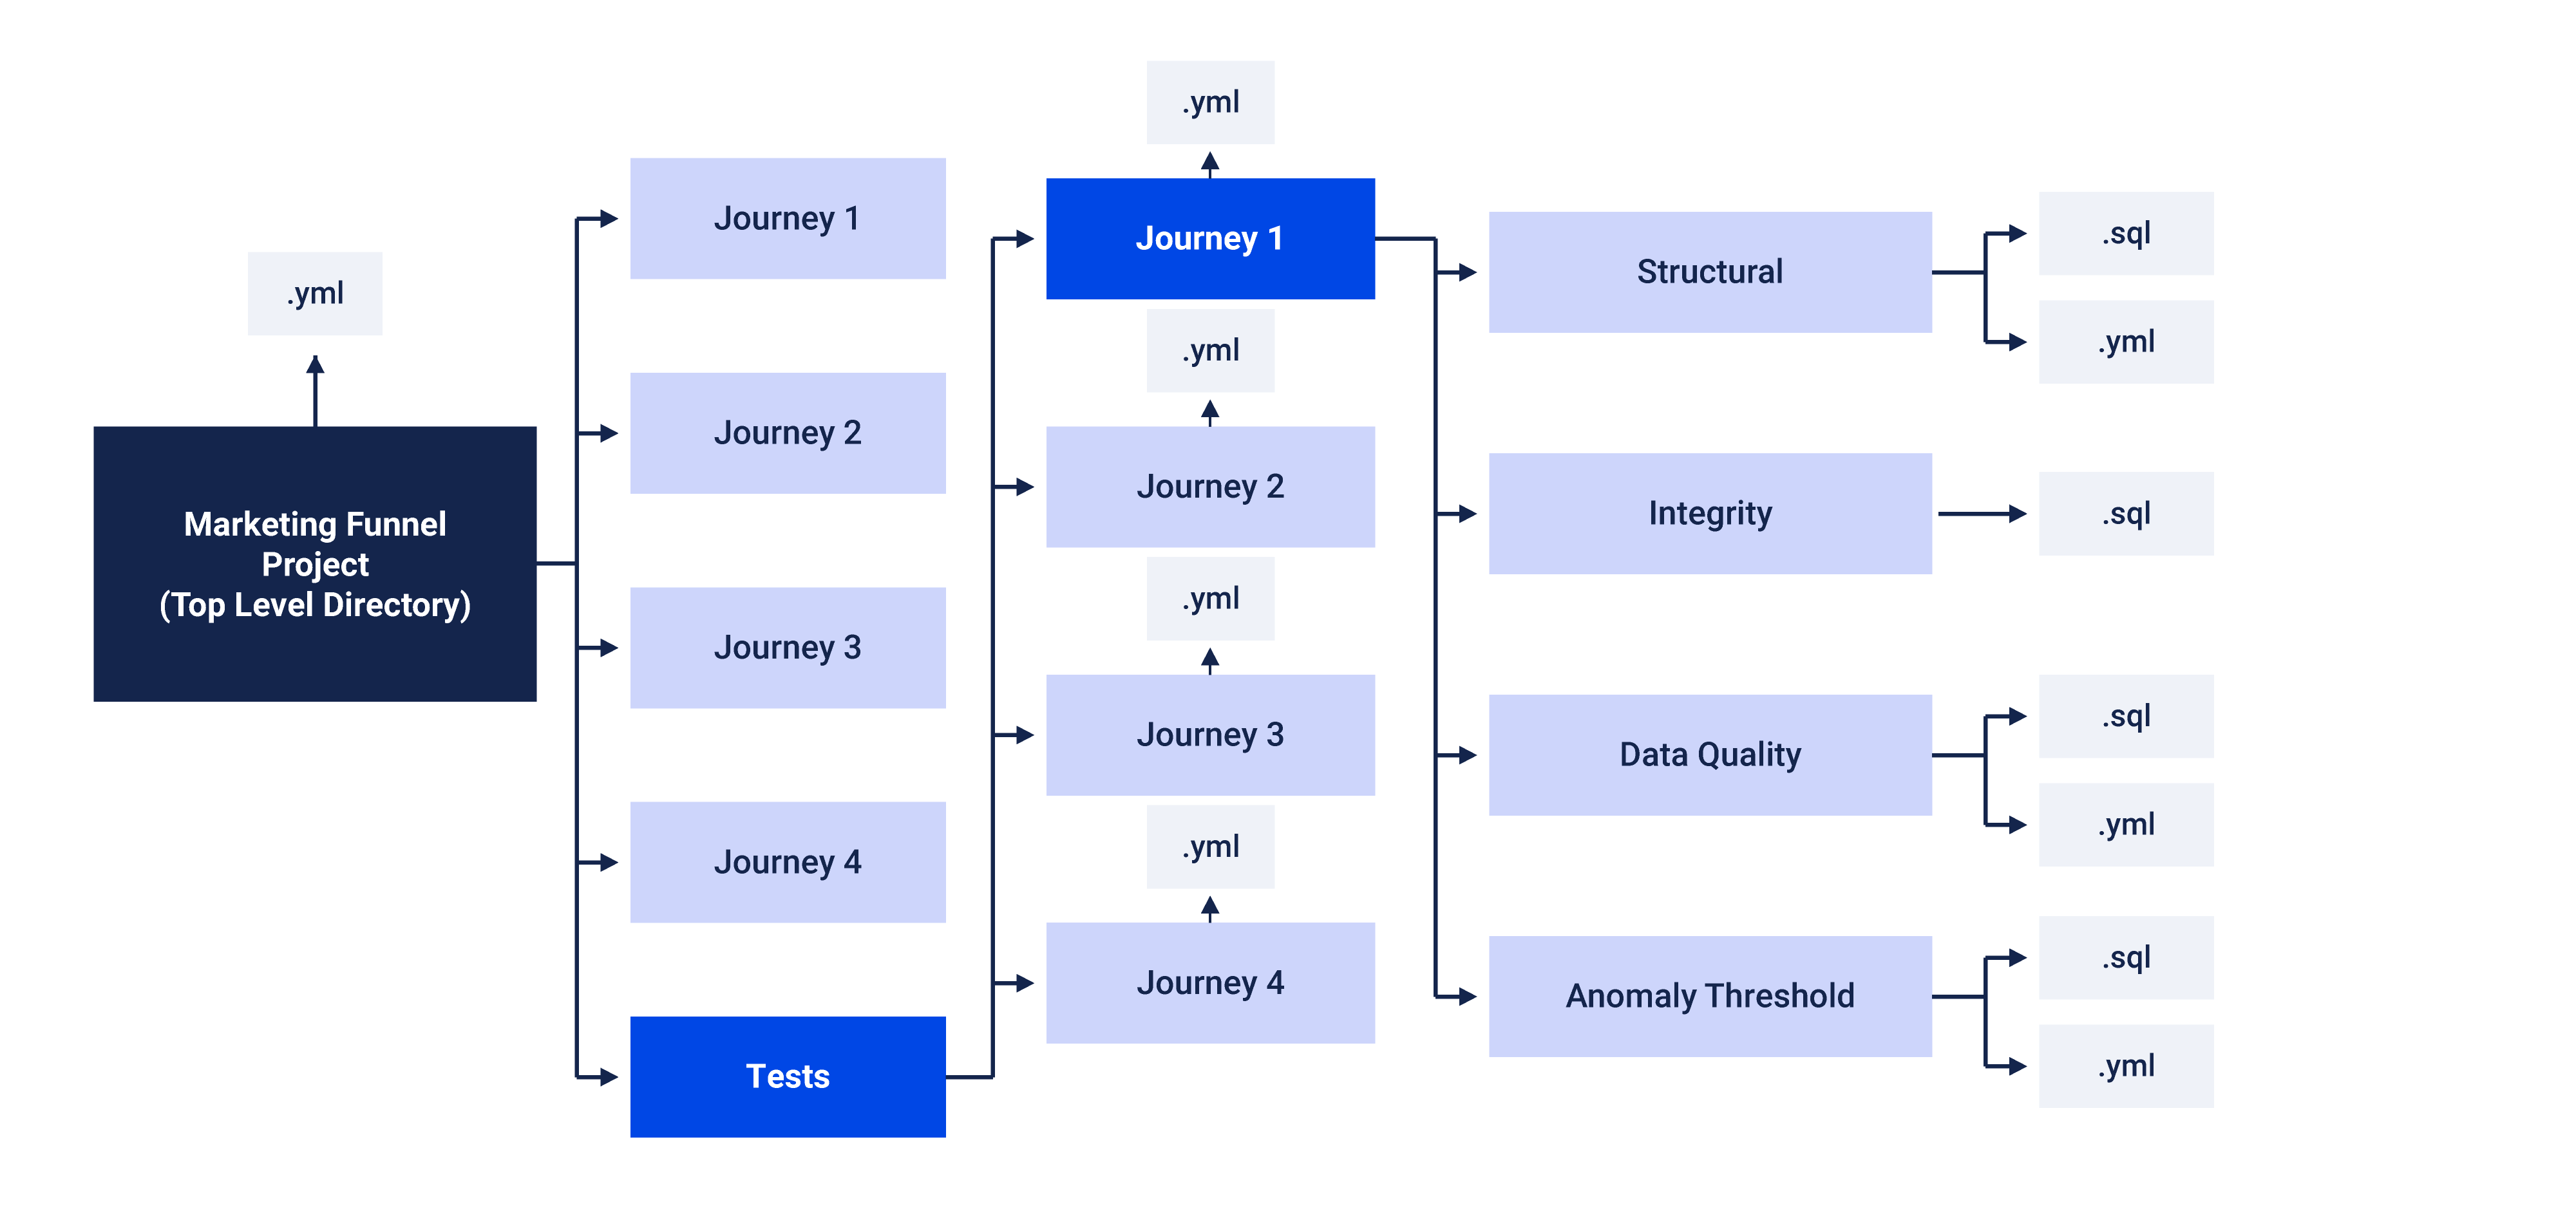
The entire project was built on top of Lakeflow Jobs with DAB. This gives full control over the flow, dependencies, scheduling, and triggers. Lakeflow orchestrates the entire journey process, which involves each campaign having multiple steps, plus dozens of tests. This is handled through resource YAML files hierarchically organized by logical module and merged into the top-level databricks.yml. Each journey has a master job that orchestrates the process across two high-level tasks: transformations that generate tables, and tests. Within transformations, there are individual tasks for each step that build the funnel tables. The image below shows the overall project structure:
A DAB (Declarative Automation Bundle) is a way to bundle an entire project into a unified system, deploying all configurations, artifacts, resources, and variables to the target Databricks environment. Everything built goes automatically to the right environment, along with what it needs to run, including the defined jobs, the clusters used for each task, and the necessary permissions, all coordinated through a set of YAML files, with a single top-level file orchestrating everything.
At the top, a single orchestration yaml coordinates two major jobs: the funnel process and the tests. Inside the funnel process job, another yaml aggregates all the individual transformation tasks, one for each funnel step. Inside the tests job, there are four yamls, one for each test type: anomaly, structural, integrity, and data quality. Each of these, in turn, contains the individual SQL tasks that make up that specific test.
At a high level, the YAML files fall into two groups:
Higher-level YAMLs (the top-level orchestration YAML, the funnel process YAML, and the tests YAML) hold the configuration that ties everything together:
- Jobs and clusters - the job definitions and the clusters used to run each task.
- Permissions - access control for jobs and resources.
- Environment variables - since object names differ between dev and prod workspaces, prefixes are defined as variables to keep the deployment consistent across environments.
- Selected emails, Service Principal (SP) ID, and SQL warehouse ID - configuration needed for the project to run under the right identity and compute.
Lower-level YAMLs (the four test type files, and each individual step's file) hold essentially the tasks themselves:
- SQL files (Resources) - the individual transformation and test tasks that make up the logic.
Secrets themselves aren't stored in the YAMLs. They live in GitHub, used by the CI/CD GitHub Action responsible for the deployment.
The CI/CD workflow has three stages. The first is a feature branch where new features are built. Once ready, this feature branch goes to the development branch (also called preprod) for testing. If everything goes well, a PR is opened to be merged into main (production), and after review, the code reaches production.
The two environments, preprod and production, are separate workspaces with access to separate catalogs, with total separation between them.
CI/CD is triggered when a branch is merged into development, deploying the DAB to that environment. The same happens on main, with deployment to production. This runs through GitHub Actions, which handles tests, validations, and the actual deployment to the correct environment. In both dev and prod, everything is managed by a Service Principal, with no single user owning the artifacts.
With DABs properly configured, alongside GitHub Actions and its CI/CD file, the whole process becomes significantly simpler to manage. Whether it's a fix or a new feature, the workflow is the same: write the code, move through each stage, and have it automatically deployed to production.
Lineage Makes Complex Business Logic Traceable
Working as an Analytics Engineer often means dealing with code shaped by complicated business rules that don't align cleanly with how the underlying data was structured. This results in pipelines that are hard to explain with a simple definition, "table with customer transactions" is rarely accurate on its own, which is why lineage and governance matter here. Documentation needs to cover not only the technical side, the code and what it does, but also the business rules, the flow, and what tables and columns actually mean.
Databricks addresses much of this by default. Lineage comes for free when objects are created (views or tables), and the UI can be used to investigate an object's upstream and downstream flow, down to the column level.
Tags add another layer, serving purposes beyond simple classification. They make it easy to identify what a table is about, which team it belongs to, and its level of granularity. Tags are free-form, and permissions can be assigned to them at both the table and column level, adding a security dimension as well.
Descriptions can also be written for tables and columns, which helps significantly when someone new is trying to understand what the data in a table actually means.
All tables in the funnels implement this: tags, descriptions, and column comments.
Writing all of this manually could be a significant undertaking given the number of tables involved, but there are two ways to automate the process. The first is Databricks' automatic generation, available directly from the UI. This works well for simple tables with obvious columns, but since the generator doesn't have access to the code that produced a table, descriptions for tables with complex rules tend to stay generic, useful as a starting point, but still requiring manual refinement. The second approach is using a generative AI tool to write descriptions and tags based on the underlying code, then incorporating that directly into the table creation code. This method required only minor manual adjustments to the final result.
Alongside a markdown file focused on the project's technical documentation (explaining how the code works, the rules, and how the project is structured), this gives the project expansive governance of its artifacts inside Databricks itself, making it significantly easier for new people to discover and understand how the whole project works.
Full-Funnel Visibility Exposes Issues Faster
We showed a few visuals and the stakeholders were thrilled. The numbers are now definitive, though we've entered a continuous process of adjustments as needed, some coming from business rule refinements, others from a better understanding of certain aspects of the data. Even in early adoption, the framework has already sparked real discussions and delivered fast impact. One example: the eligibility parameters selecting customers to enter journeys were only considering a one year history, instead of a customer's full history. Another journey revealed that conversion and redemption are practically separate from each other, showing that the redemption offer isn't being used as much as we'd like it to be. What we can say is that several hours spent trying to find the root cause of a problem that went undetected for weeks will now be saved. If we multiply this across every process, we can prevent not only hours of troubleshooting, but also money being wasted on campaigns that don't work, after all, we now have a complete funnel of the campaigns.
Another major benefit is scalability, which was proven during the project's construction itself. One journey was chosen as an MVP and built completely to test and validate the structure. Once ready, this framework was used to build the remaining journeys, which happened in a fraction of the time of the first (something that took weeks for the first journey took a single day for the others).
The Funnel Creates a Foundation for Predictive Optimization
This project opened the door to numerous campaign management opportunities, where stages can be optimized and each one's performance improved. In the near horizon, over the next few months, more steps will be added to the funnel, specifically around communication, understanding whether a customer actually interacted with it, such as whether an email was opened or clicked.
It also provides the foundation to build ML models that predict the likelihood of a customer completing a journey, forecast how much each journey generates per customer, and support other related projects. The ultimate goal is an agent that receives information from these models to decide the best journey for customers. ML and the agent will be a POC over the next few quarters, made easier by Databricks tools, especially MLflow and the entire suite surrounding ML.