


Turning Banner Personalization Into Revenue
Giving Every Shopper a More Relevant Experience
A leading global retailer sells through its physical stores, website, and mobile app. The hero and marketing banners on its website and app get a lot of traffic, but the banners shown there were chosen by hand. Every shopper saw the same banners, so the retailer was missing chances to increase clicks and, above all, conversions.
Factored built a ranking system that chooses which banners each shopper sees in those spots. It ranks a pool of existing banners using data about the shopper and about each banner. The result was Millions of dollars in calculated annualized incremental revenue (AIR) and an increase in click-through rate (CTR).
Banners Were Chosen by Hand
The busiest placements on the website and app showed banners chosen by hand. Every shopper saw the same banner, no matter what they had viewed or bought. This limited clicks (CTR) and, more importantly, conversions (CVR).
Two placements mattered most:
- Hero banner: The most important placement on the website and app. It is the first thing shoppers see.
- Marketing banners: A row of banners further down the page that shows other important campaigns.
The solution had to:
- Rank the existing pool of banners instead of creating new ones.
- Use data about both the shopper and the banner.
- Increase clicks and, above all, conversions.
- Work on both the website and the mobile app.
Personalized Ranking Across Web and Mobile
Factored built a ranking system to replace manual selection. For each shopper and placement, it gives every banner in the pool a score and shows the highest-scoring ones. Clicks and conversions are used to retrain the model, so the ranking improves over time.
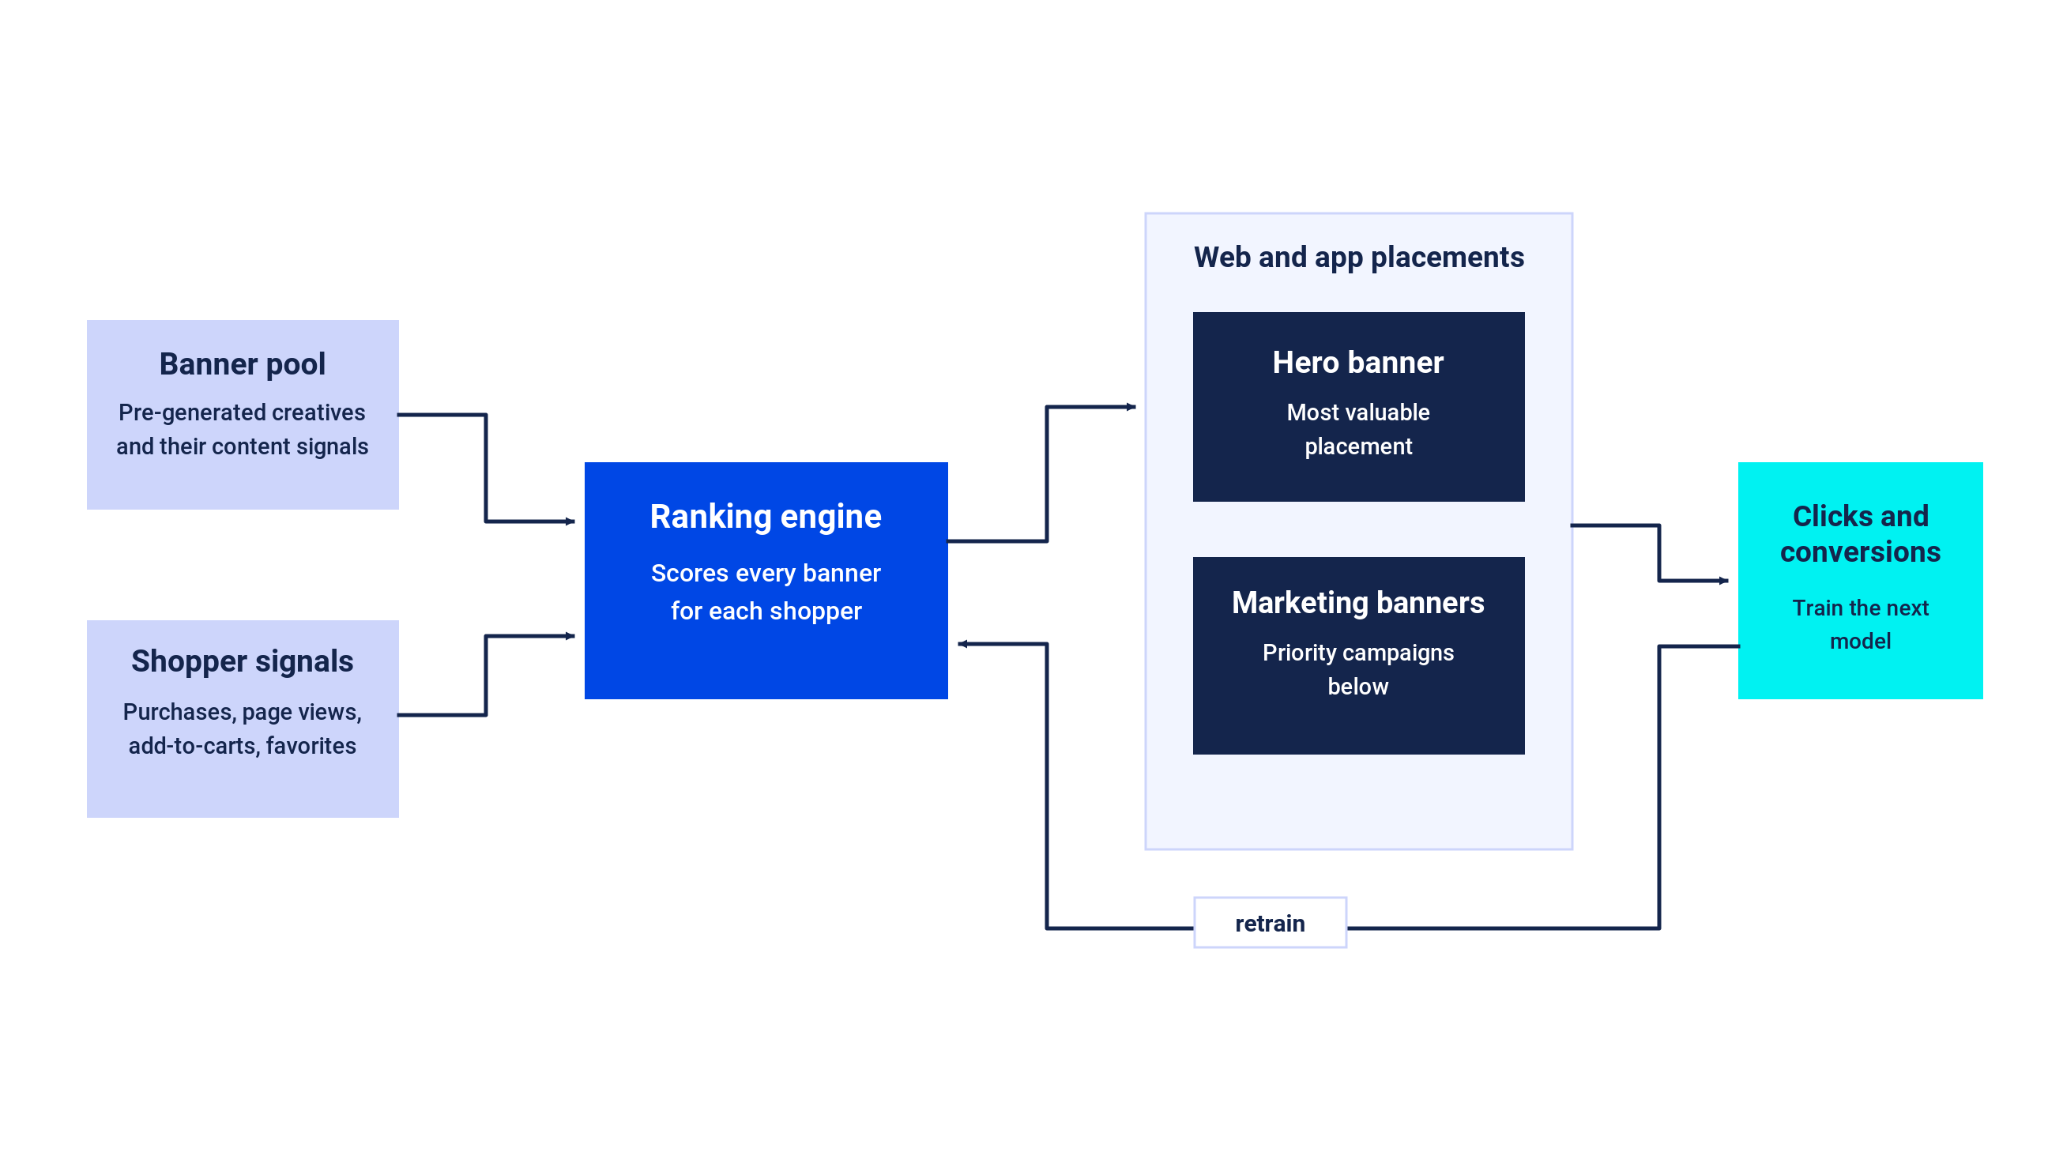
Banner and shopper data go into one ranking system for both placements. Clicks and conversions are used to train the next model.
Engineering Personalization at Scale
The whole system runs on Databricks, from raw event data to trained models. PySpark and Spark SQL turn raw purchase, page view, add-to-cart, and favorite events into shopper behavior sequences, and the same jobs build the training examples and the reports on impressions and promotions. The Wide & Deep ranking model and the GraphSAGE embedding model are built and trained in PyTorch. MLflow tracks each training run, logging its parameters and offline metrics such as AUC and NDCG@10, and its Model Registry versions every candidate, so each A/B candidate traces back to the run that produced it. Databricks Workflows refresh the data and retrain the model every month, adding the latest clicks and conversions to the training data, and each new checkpoint is checked for stability against the previous one.
1. Turning Shopper Behavior Into Ranking Signals
Data is ingested through integrations with the retailer's existing customer databases and stored in the Databricks lakehouse. The model's dataset follows a Medallion Architecture, where each layer adds structure and quality:
- Bronze: Raw data as it lands from the customer databases: purchase, page view, add-to-cart, and favorite events, banner data, and logged impressions.
- Silver: Cleaned and standardized data. Events become shopper behavior sequences, and banners get their text embeddings.
- Gold: Model-ready tables, including the training examples and the reports on impressions and promotions.
The model uses two kinds of signals. On the shopper side, it sees the sequence of recent actions: purchases, product page views, add-to-cart events, and favorites. On the banner side, text embeddings represent the text associated to each banner. Before building any model, we compared banner embeddings with shopper behavior, and t-tests and Kolmogorov–Smirnov tests showed that banner content helps predict clicks.
Training examples are built with as-of joins, so each impression is paired with the embeddings that existed at that time and no future information leaks into training. Model outputs are logged as nested JSON, which we parse with PySpark and join with impression and promotion data in Spark SQL.
2. Predicting Which Banners Drive Action
The ranking model is a Wide & Deep network that models the interactions between shoppers and banners. For each shopper–banner pair, it predicts how likely the shopper is to interact with the banner. The system then sorts the banners in the pool by that score.
- Wide part: A linear model over cross features that pair shopper attributes with banner attributes. It memorizes combinations that have worked well in the past.
- Deep part: Shopper and banner features, including the embeddings described above, go through a feed-forward neural network. It generalizes to shopper–banner pairs that are rare or new.
Both parts are trained together on logged impressions, with clicks and conversions as labels. The model learns which banners get attention and which ones lead to a purchase, while balancing memorization and generalization. A later version added GraphSAGE embeddings as extra inputs to the deep part.
3. Validating Performance With Live A/B Testing
We evaluate every candidate model in two steps: offline on historical data, then online with an A/B test. The A/B test gives the final answer, and the results in this post come from it.
- Offline metrics: On historical impressions, we compute AUC and NDCG@10. AUC measures how well the model separates banners a shopper interacted with from banners they ignored. NDCG@10 measures whether those banners are ranked near the top of the list.
- Online A/B test: The best offline candidate is tested against the current setup on live traffic.
Offline metrics are fast and cheap, so we use them to filter candidates. Getting that comparison right took extra work: our evaluation framework compares persona-based ranking with embedding-based models, with clear rules for ties and for the level at which results are measured.
Personalization That Drives Revenue
Ranking banners for each shopper increased both clicks and revenue.
Impact:
- Millions of dollars in annualized incremental revenue: Calculated AIR from personalized banner ranking.
- Click-through rate: More shoppers clicked on banners in the hero and marketing placements.
Revenue and Marketing Efficiency:
- More revenue, not just clicks: The model was built to increase conversions, not only clicks, so the gain shows up in revenue. Each placement now shows the banner a shopper is most likely to act on.
- Better use of the top placements, with no more guessing: The hero and marketing banners now show content that fits each shopper. Instead of guessing which single banner will work for everyone, the team can see which banners work for which shoppers. They now know their customer base much better.
- Less manual work, more focus on content: The system picks from the existing banner pool, so banners are no longer chosen by hand. The marketing team saves that time and spends it on creating better content. Knowing what each audience responds to, they can direct their effort where it has the most impact.